
-
Best Forex Brokers
Our top-rated Forex brokers
-
Islamic Account Brokers
Best accounts for Muslim traders
-
Brokers for Beginners
Start trading here
-
Forex Demo Accounts
Learn to trade with no risk
-
No-deposit Bonuses
Live trading with no deposit
-
ECN Brokers
Trade with Direct Market Access
-
Lowest Spread Brokers
Raw spreads & low commissions
-
High Leverage Brokers
Extend your buying power
-
Market Maker Brokers
Fixed spreads & instant execution
-
MetaTrader 4 Brokers
Top MT4 brokers in Malaysia
-
MetaTrader 5 Brokers
Top MT5 brokers in Malaysia
-
TradingView Brokers
Top TradingView brokers
-
cTrader Brokers
Top cTrader brokers in Malaysia
-
Forex Trading Apps
Trade on the go from your phone
-
Copytrading Brokers
Copy professional traders
-
All Trading Platforms
Find a platform that works for you


Last Updated On October 7, 2023

Forex trading is almost impossible without the use of a chart. A chart is merely a graphical demonstration of the currency exchange rates and it shows how a specific currency exchange rate has performed over any given period of time. The primary purpose of using a Forex chart is to identify tradable patterns and apply technical analysis. Most Forex brokers will provide you with professional charting software free of charge, which allows a trader to observe historical currency exchange rates and make an informed trading decision with ease.
Type of Forex Charts
There are different types of charts – the most popular type of charts are the candlestick charts but there are other charts you might be able to use for different purposes. The most common types of Forex charts are:
- Line charts;
- Bar Charts;
- Candlestick Charts;
These different price charts types should give you a good sense of how the markets move, and how professional Forex traders might use them to find trading opportunities. As a short-term trader, learning to read a Forex chart is imperative to your success – as is understanding how each different Forex chart can help you to time your trade entries and exits.
Line Forex Charts
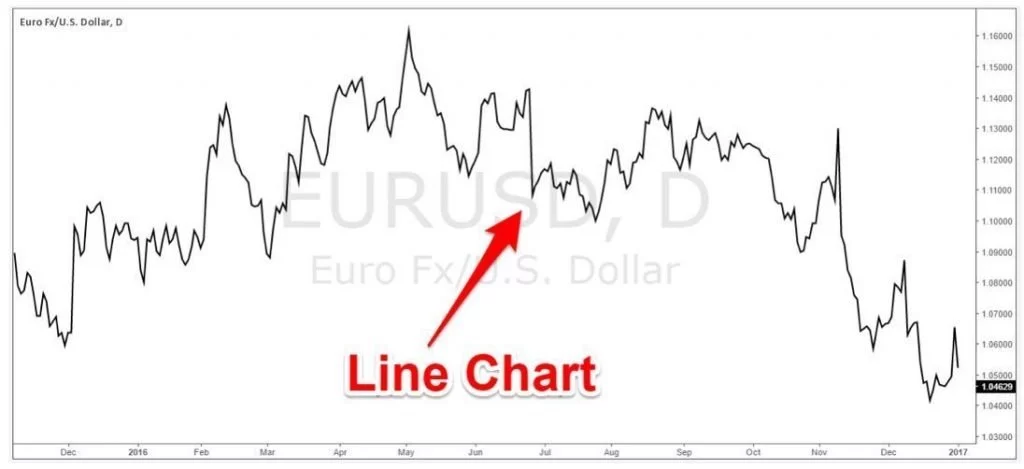
Line Chart
A line chart presents the same information as your candlestick chart, but the data is represented by a line. The line correlates to the closing distance of each of the closing prices in each of the candles. A line chart is best used for drawing clear support and resistance levels and identifying chart patterns. The main advantage of a line chart is its simplicity as it clears up a lot of market noise.
Bar Forex Charts
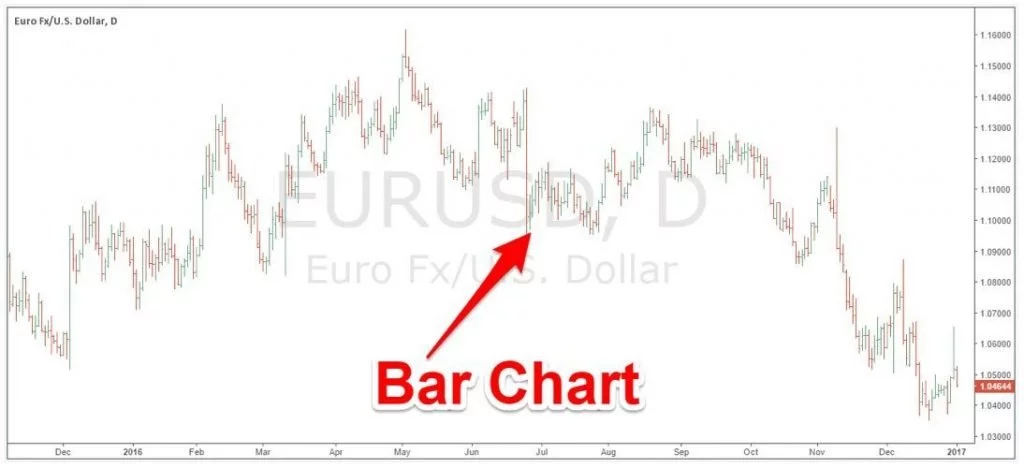
Bar Chart
Bar charts are similar to candles but they don’t have the fat body part. They show you where the price opens for that time frame and where it closes on that time frame. It also displays the high and low of the respective time frame. A bar chart is an open, high, low and close bar chart or OHLC in the Forex terminology.
The open of a bar chart is the beginning of the trading day, the low is the bottom of the bar chart and is the lowest price of which the transaction occurred throughout the day, the high is the highest price that was transacted throughout the day, and the close is the price at the end of the day or any specific time frame.
Candlestick Forex Charts
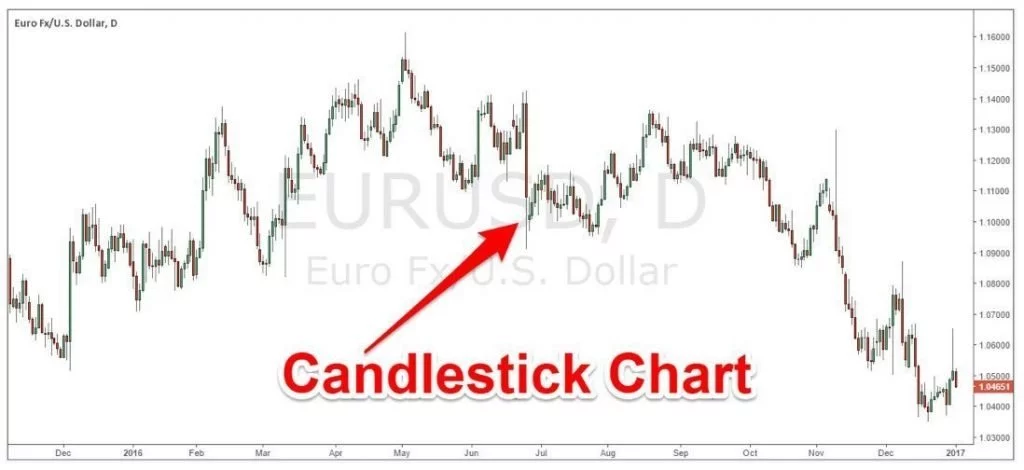
Candlestick Chart
A candlestick chart is the most common type of chart traders use. A green candle typically indicates that prices moved up during that particular period while a red candle indicates that prices moved to the downside during that period of time. When we’re looking to identify the direction of the market we should focus simply on the colour of the candle and ask “which one is dominating”?
The size of the candle also gives us clues as to how strong the momentum may be, also the shape of the candles can give us lots of information in terms of the momentum shifts in the market as well as identifying repeatable price patterns.
Conclusion
We’re not limited to just these three forms of charting as there are other types of Forex charts like the Tick Chart, Range Bar Chart, Point & Figure Chart, Renko Chart and many others.
A Forex chart is like a whole new language that you need to learn how to read. You also have to understand that chart analysis is part science in that we’re looking at a history of price data repeating itself but it’s also part art and that you might draw your chart lines and patterns differently than the trader next to you. You’ll get more confident with the skill set of charting as you move forward and get more experience.
Share your knowledge


Stay updated
This form has double opt in enabled. You will need to confirm your email address before being added to the list.