
-
Best Forex Brokers
Our top-rated Forex brokers
-
Islamic Account Brokers
Best accounts for Muslim traders
-
Brokers for Beginners
Start trading here
-
Forex Demo Accounts
Learn to trade with no risk
-
No-deposit Bonuses
Live trading with no deposit
-
ECN Brokers
Trade with Direct Market Access
-
Lowest Spread Brokers
Raw spreads & low commissions
-
High Leverage Brokers
Extend your buying power
-
Market Maker Brokers
Fixed spreads & instant execution
-
MetaTrader 4 Brokers
Top MT4 brokers in Malaysia
-
MetaTrader 5 Brokers
Top MT5 brokers in Malaysia
-
TradingView Brokers
Top TradingView brokers
-
cTrader Brokers
Top cTrader brokers in Malaysia
-
Forex Trading Apps
Trade on the go from your phone
-
Copytrading Brokers
Copy professional traders
-
All Trading Platforms
Find a platform that works for you


Last Updated On October 7, 2023

Chart patterns are distinctive price formations on price action charts, which are used in technical analysis to understand price information and forecast trends. Some chart patterns will occur more often than others, and by studying the historical precedents, and learning to recognize their shapes, we can trade them for profit. In technical analysis, it is assumed that history repeats itself, prices move in trends and the market factors in all information.
History will continue to repeat because human/market psychology will remain the same throughout, and by analyzing past price action, we can determine how likely these patterns are to lead to profitable trades. This way we can set realistic expectations for our trading activities and is the main reason why the signals given by these chart patterns can accurately predict future price movements. The chart patterns are a great tool to use to time the market and get confirmation on our trade ideas.
Two Types of Chart Patterns
In the study of technical analysis, we can distinguish between two types of chart patterns:
- Reversal Patterns
- Continuation Patterns
Depending on where these patterns develop relative to the trend, some patterns can be both reversal and continuation patterns. For example, a symmetrical triangle in the middle of the trend can act as a continuation pattern if the resistance line sloping downwards is broken. At the same time, the symmetrical triangle at the end of the trend can act as a reversal pattern if the support line sloping upwards is broken. Here is a quick review of the most popular chart patterns and give you a brief introduction to each.
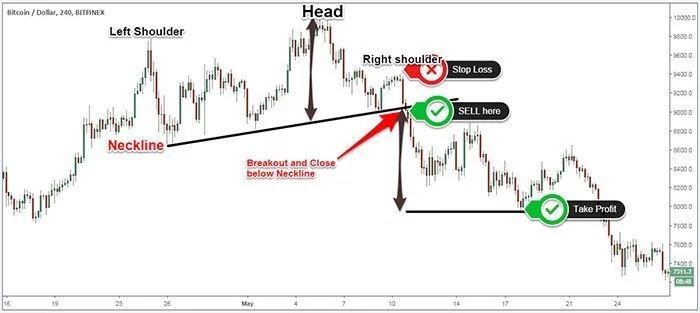
Head and Shoulder Reversal Pattern
The Head and Shoulder is a bearish reversal pattern that signals the possibility of the prevailing trend may end, and a new trend in the opposite direction might start. The standard Head and Shoulder pattern consists of four major components: the left shoulder, the head, the right shoulder and the neckline. Below is a real trading example from the BTCUSD pair.
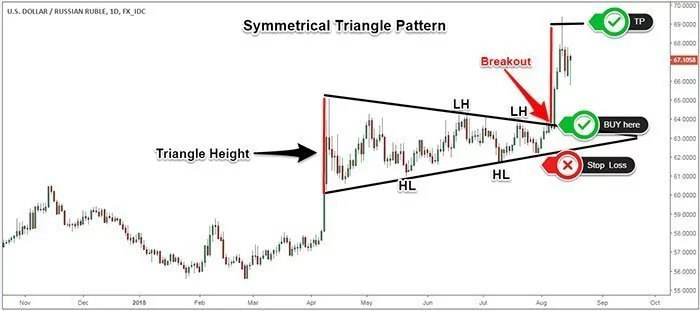
Symmetrical Triangle Continuation and Reversal Pattern
Usually, the symmetrical triangle acts as a continuation pattern that will allow you to enter into a trending market if you’ve missed the starting point of a new trend. However, there are also other instances when the support line sloping upwards is broken. This signals the possibility of a trend reversal. The symmetrical triangle is characterized by a ranging market that produces a series of lower highs that can be connected using a resistance line sloping downwards and a series of higher lows that can be connected using a support line sloping upwards. Here is a real trading example of the pattern in play.
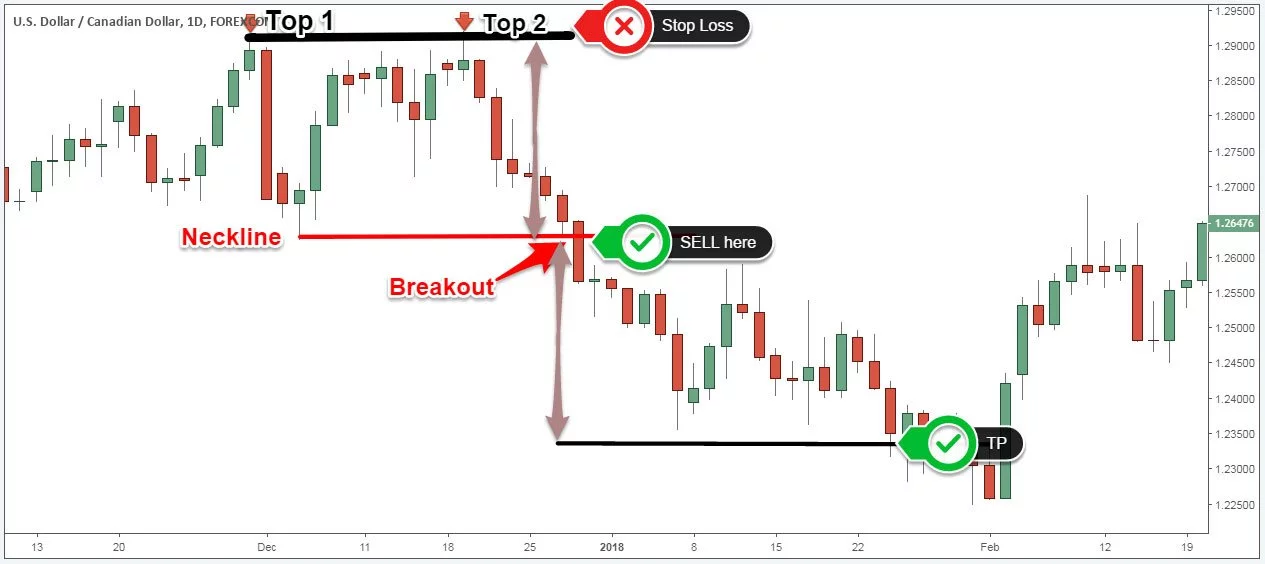
Double Top Reversal Pattern
The double top pattern is another reversal trading pattern that signals the end of a bullish trend and the start of a new bearish trend. The standard double top pattern consists of three major elements. First, for the double top, we need a prevailing uptrend followed by two consecutive highs and a neckline, which is the support level where the first pullback that emerges from the first peak stops. Below is an example of how this could look in your trading environment, including where I would enter the trade and set my take profit.
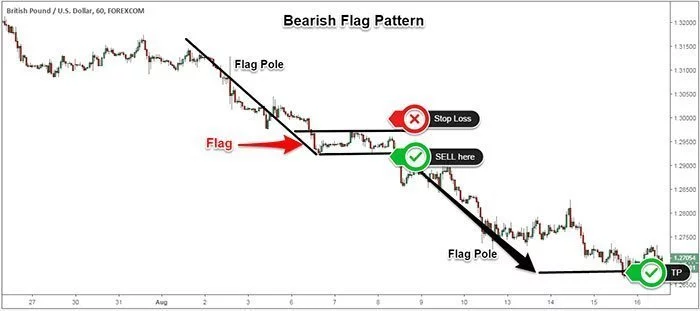
Bullish and Bearish Flag Patterns
The bullish flag pattern is formed by two distinctive elements. The first element of the flag pattern is a pre-existing trend. In the case of the bullish flag, we’re talking about an uptrend. The second element is the flag attached to the pole which looks like a horizontal pause in the trend where the market moves in a very narrow trading range between a support and resistance level. Below is an example of what a Bullish flag pattern looks like in trading.
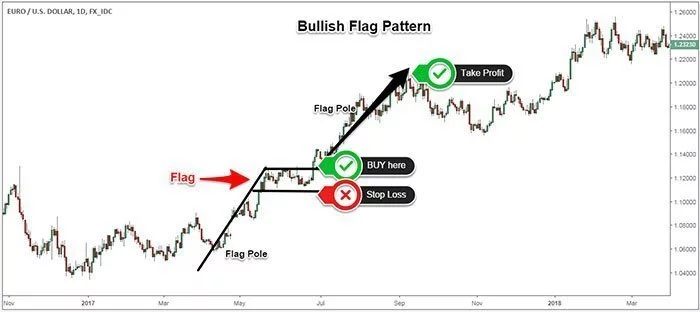
The inverse of the Bullish flag is the Bearish flag, and while everything is the same in trading, all is just inverted.
Share your knowledge


Stay updated
This form has double opt in enabled. You will need to confirm your email address before being added to the list.