
-
Best Forex Brokers
Our top-rated Forex brokers
-
Brokers for Beginners
Start trading here
-
Demo Accounts
Learn to trade with no risk
-
Lowest Spread Brokers
Raw spreads & low commissions
-
ECN Brokers
Trade with Direct Market Access
-
Islamic Account Brokers
Best accounts for Muslim traders
-
Market Maker Brokers
Fixed spreads & instant execution
-
All Trading Platforms
Find a platform that works for you
-
MetaTrader4 Brokers
The top MT4 brokers in the UK
-
MetaTrader5 Brokers
Best MT5 Brokers in the UK
-
TradingView Brokers
Best TradingView Brokers
-
cTrader Brokers
The top cTrader brokers in the UK
-
Copy Trading Brokers
Copy professional traders
-
Spread Betting Platforms
Tax-free trading
-
Forex Trading Apps
Trade on the go from your phone
-
Forex Brokers in UK
Trading from UK? Discover our top-rated brokers here!
-
Forex Brokers in USA
Trading from USA? Discover our top-rated brokers here!
-
Forex Brokers in Canada
Trading from Canada? Discover our top-rated brokers here!
-
Forex Brokers in Dubai
Trading from Dubai? Discover our top-rated brokers here!


Last Updated On February 9, 2024

This transcription was created with the assistance of AI-powered tools.
Introduction to Candlesticks
Today, we’re going to cover candlesticks and how to read them. Candlestick charts originated in Japan over 100 years before the West developed the bar and point and figure charts.
Historical Background
In the 1700s, a Japanese man named Homma discovered that while there was a link between the price and the supply and demand arise, the markets were strongly influenced by the emotions of traders. Candlesticks showed that emotion by visually representing the price moves with different colors. They also provide the quickest visual grasp of price action and the market sentiment behind it.
Candlesticks in Trading
Traders use candlesticks to make trading decisions based on regularly occurring patterns that help forecast the short-term direction of the price.
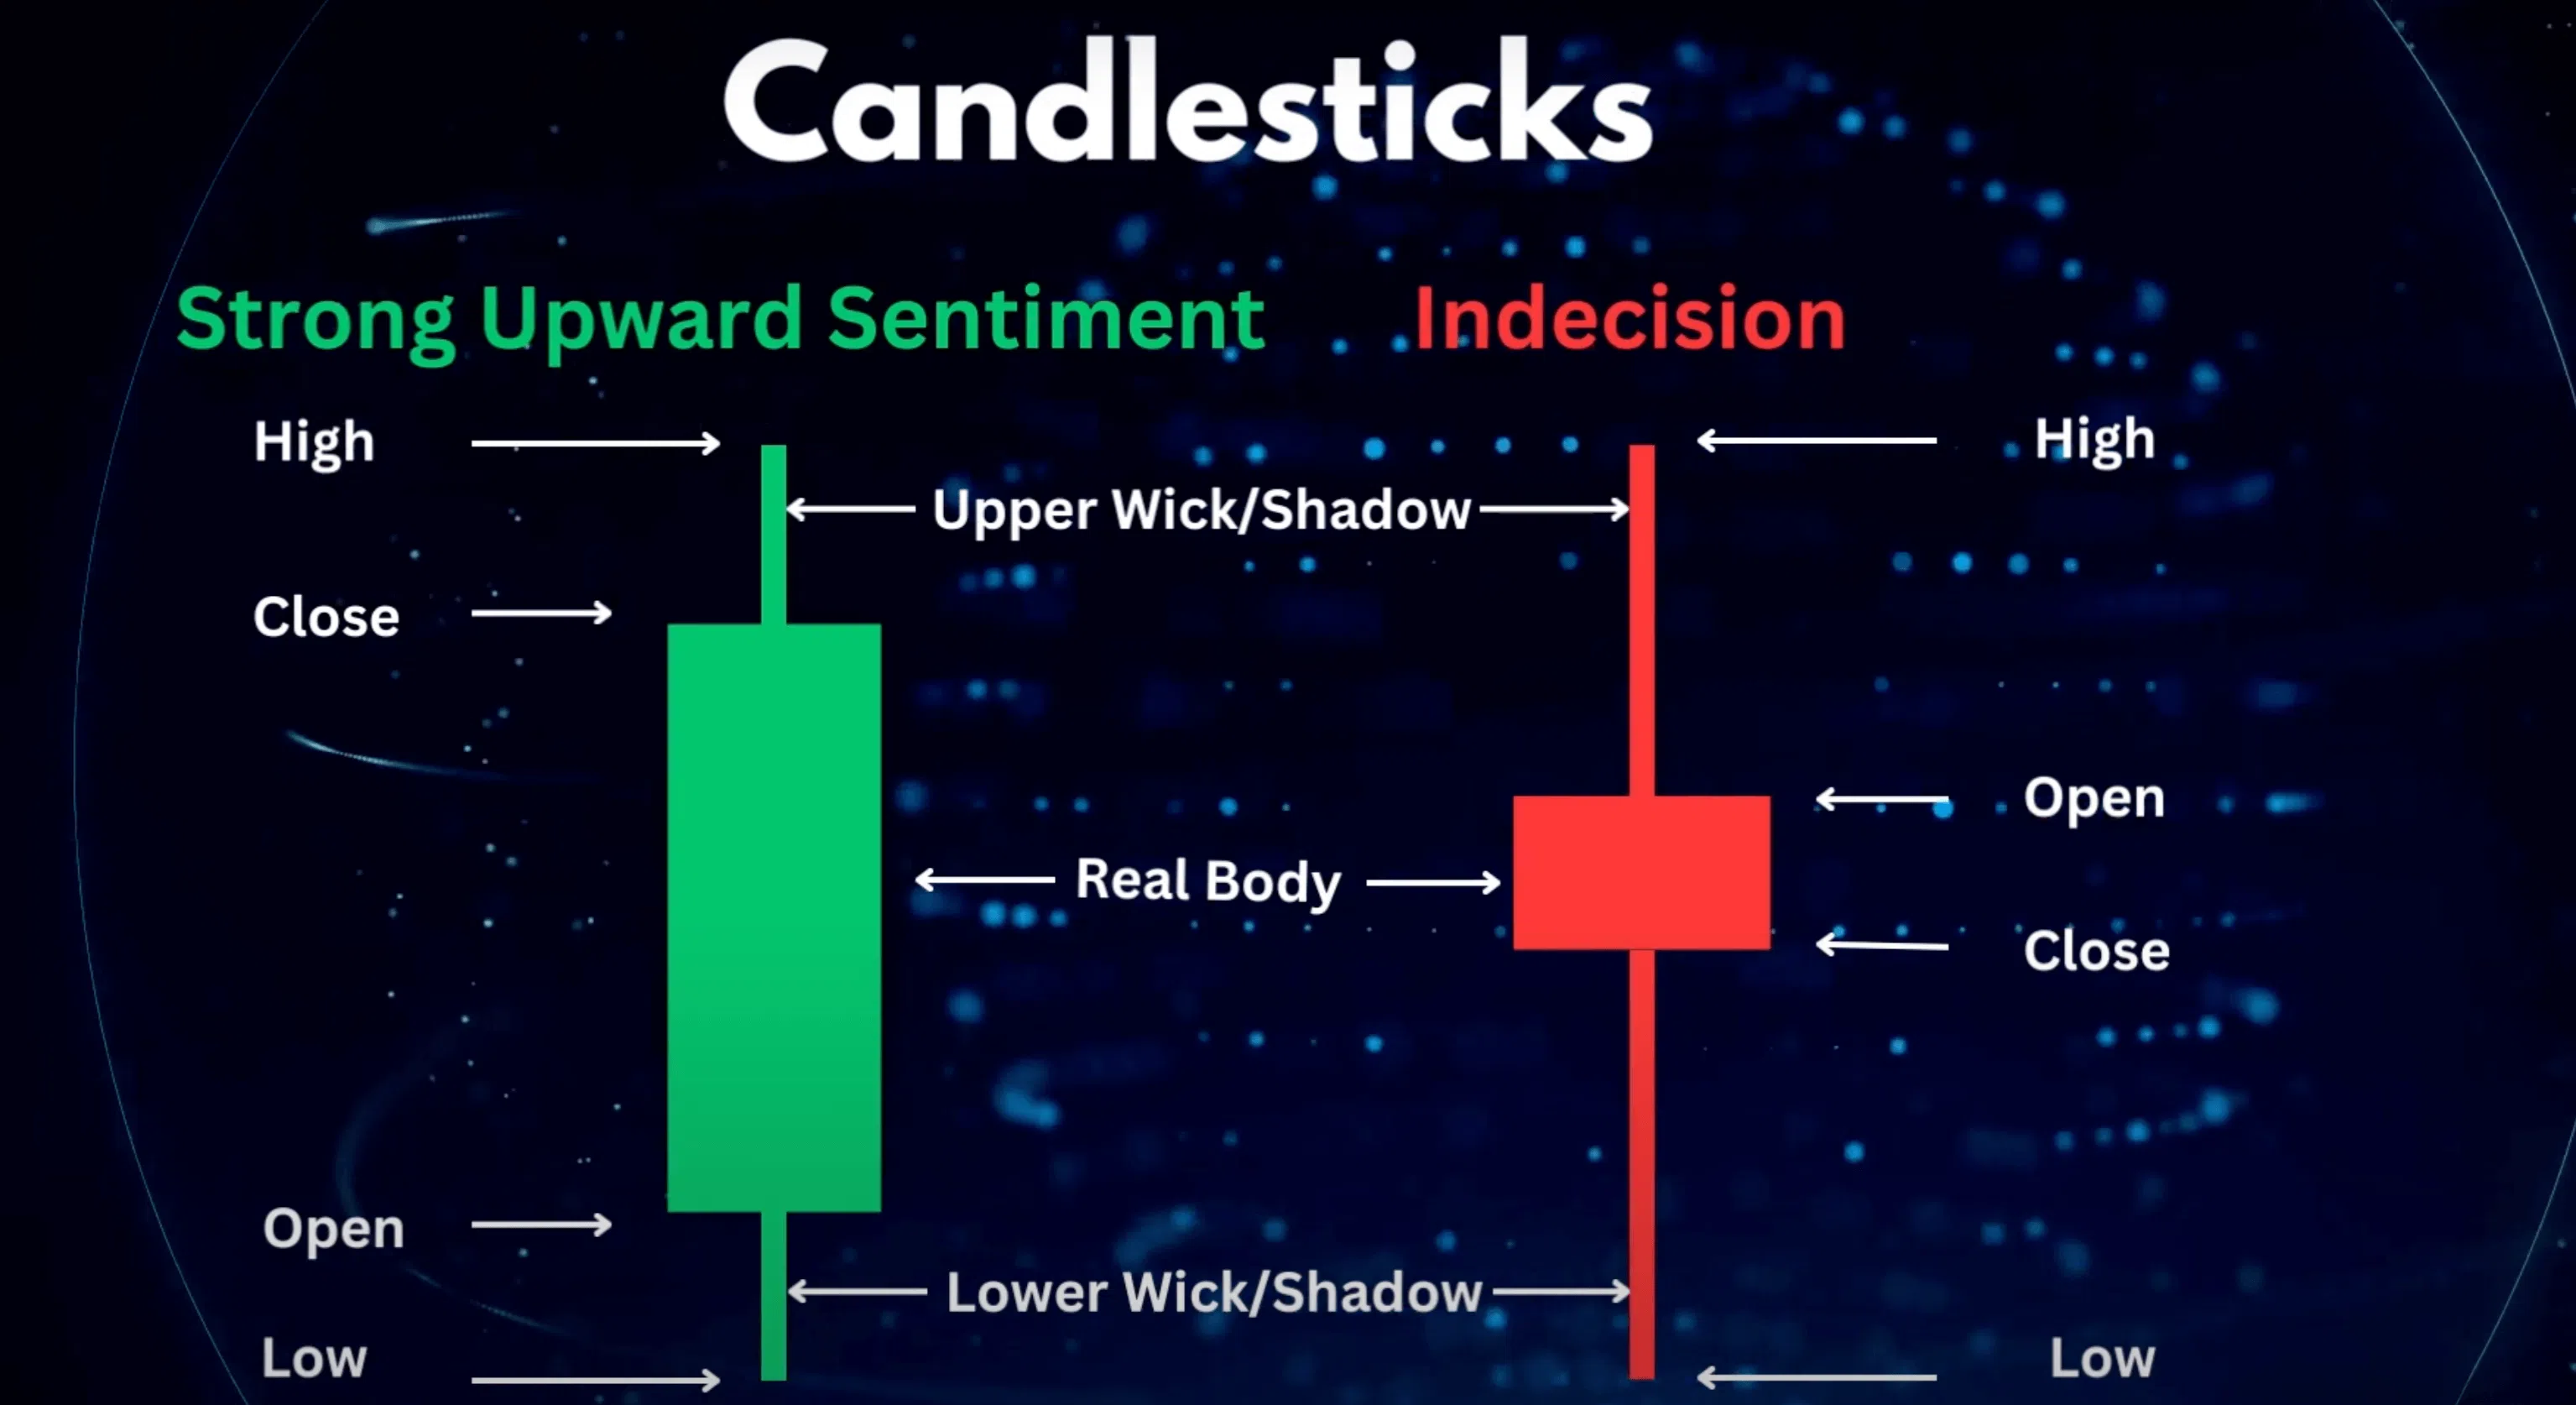
The Anatomy of Candlesticks
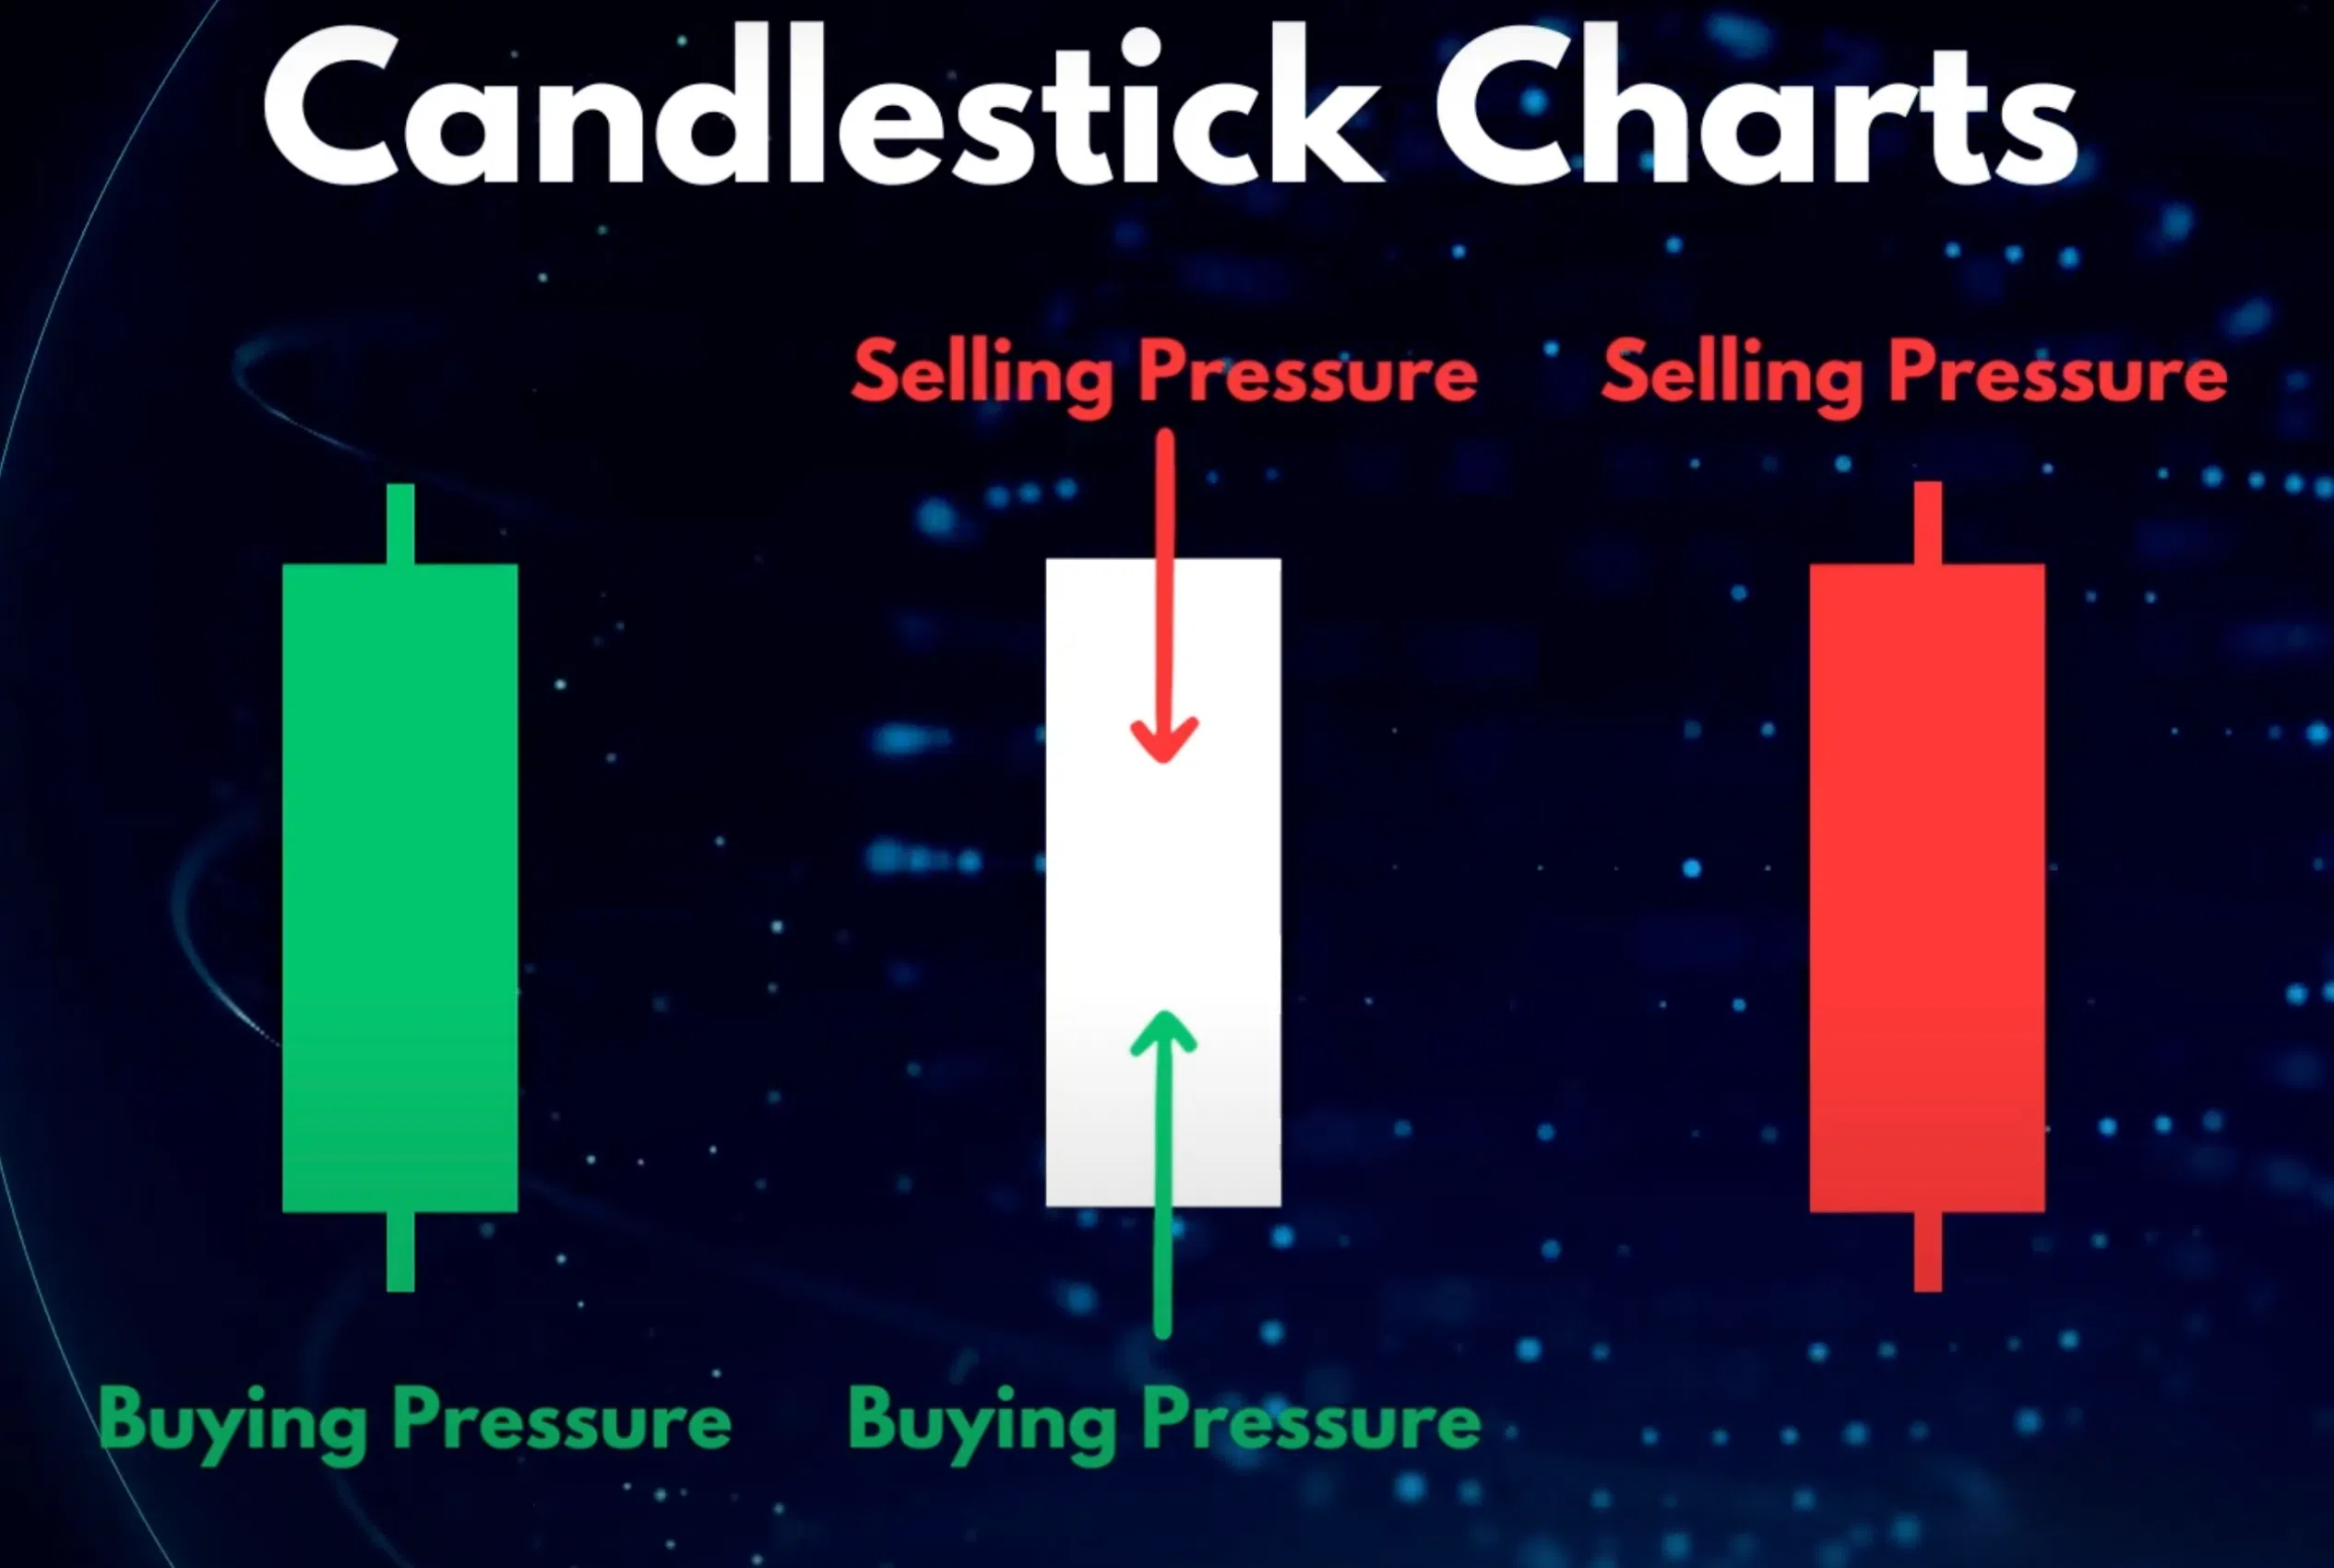
To read a book, you have to understand the letters to form meaningful words. Similarly, to read charts, we have to be able to read the candlesticks to perform meaningful patterns. Candles usually have a body and wick, also called a shadow, at both ends. The body represents the range between the open and closing price for a given period. The wicks or the shadows show the upper and lower price ranges.
Price Information in Candlesticks
Any of these individual parts may be missing from a given candle. Each candle displays all price information:
- The high of their period;
- The lower of their period;
- And the open and closing prices for a given period. The period covered by each candle depends on the time frame of the chart that you are viewing.
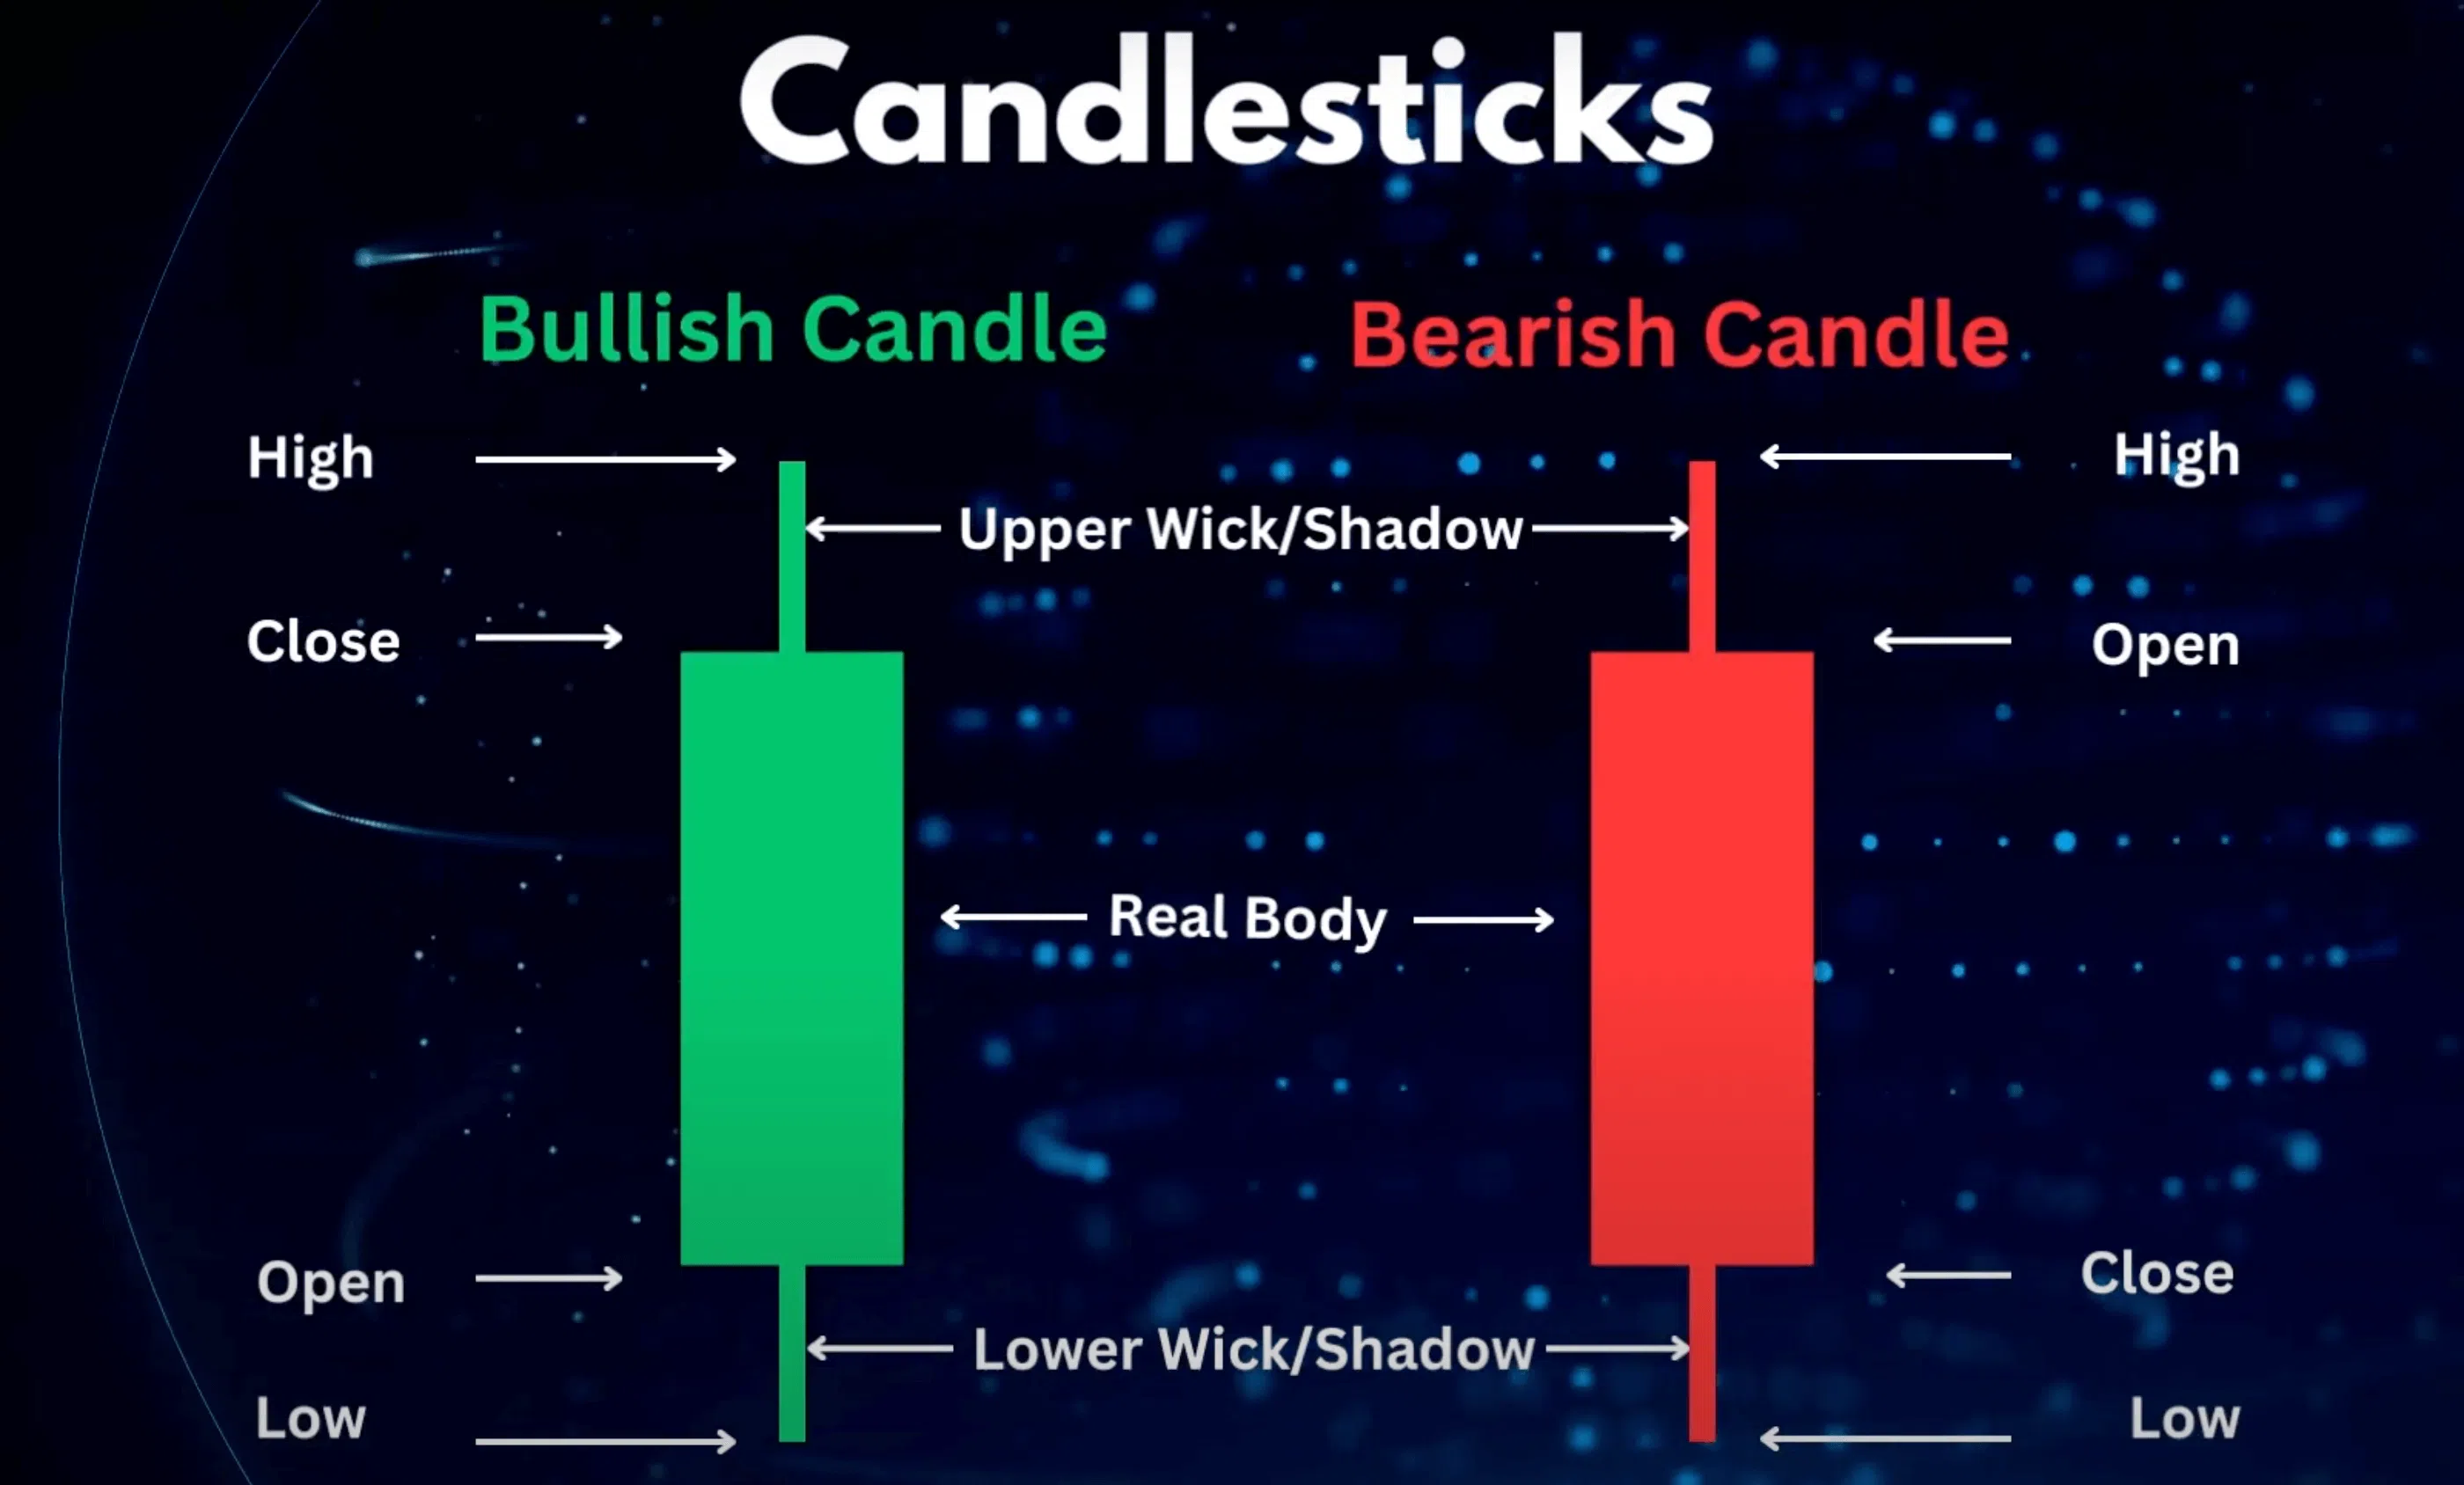
Time Frame of Candlestick Charts
Each candle on a one-minute candlestick chart covers the opening, closing, and high and low prices for one minute, and similarly, each candle on a daily candlestick chart shows this price information for an entire day.
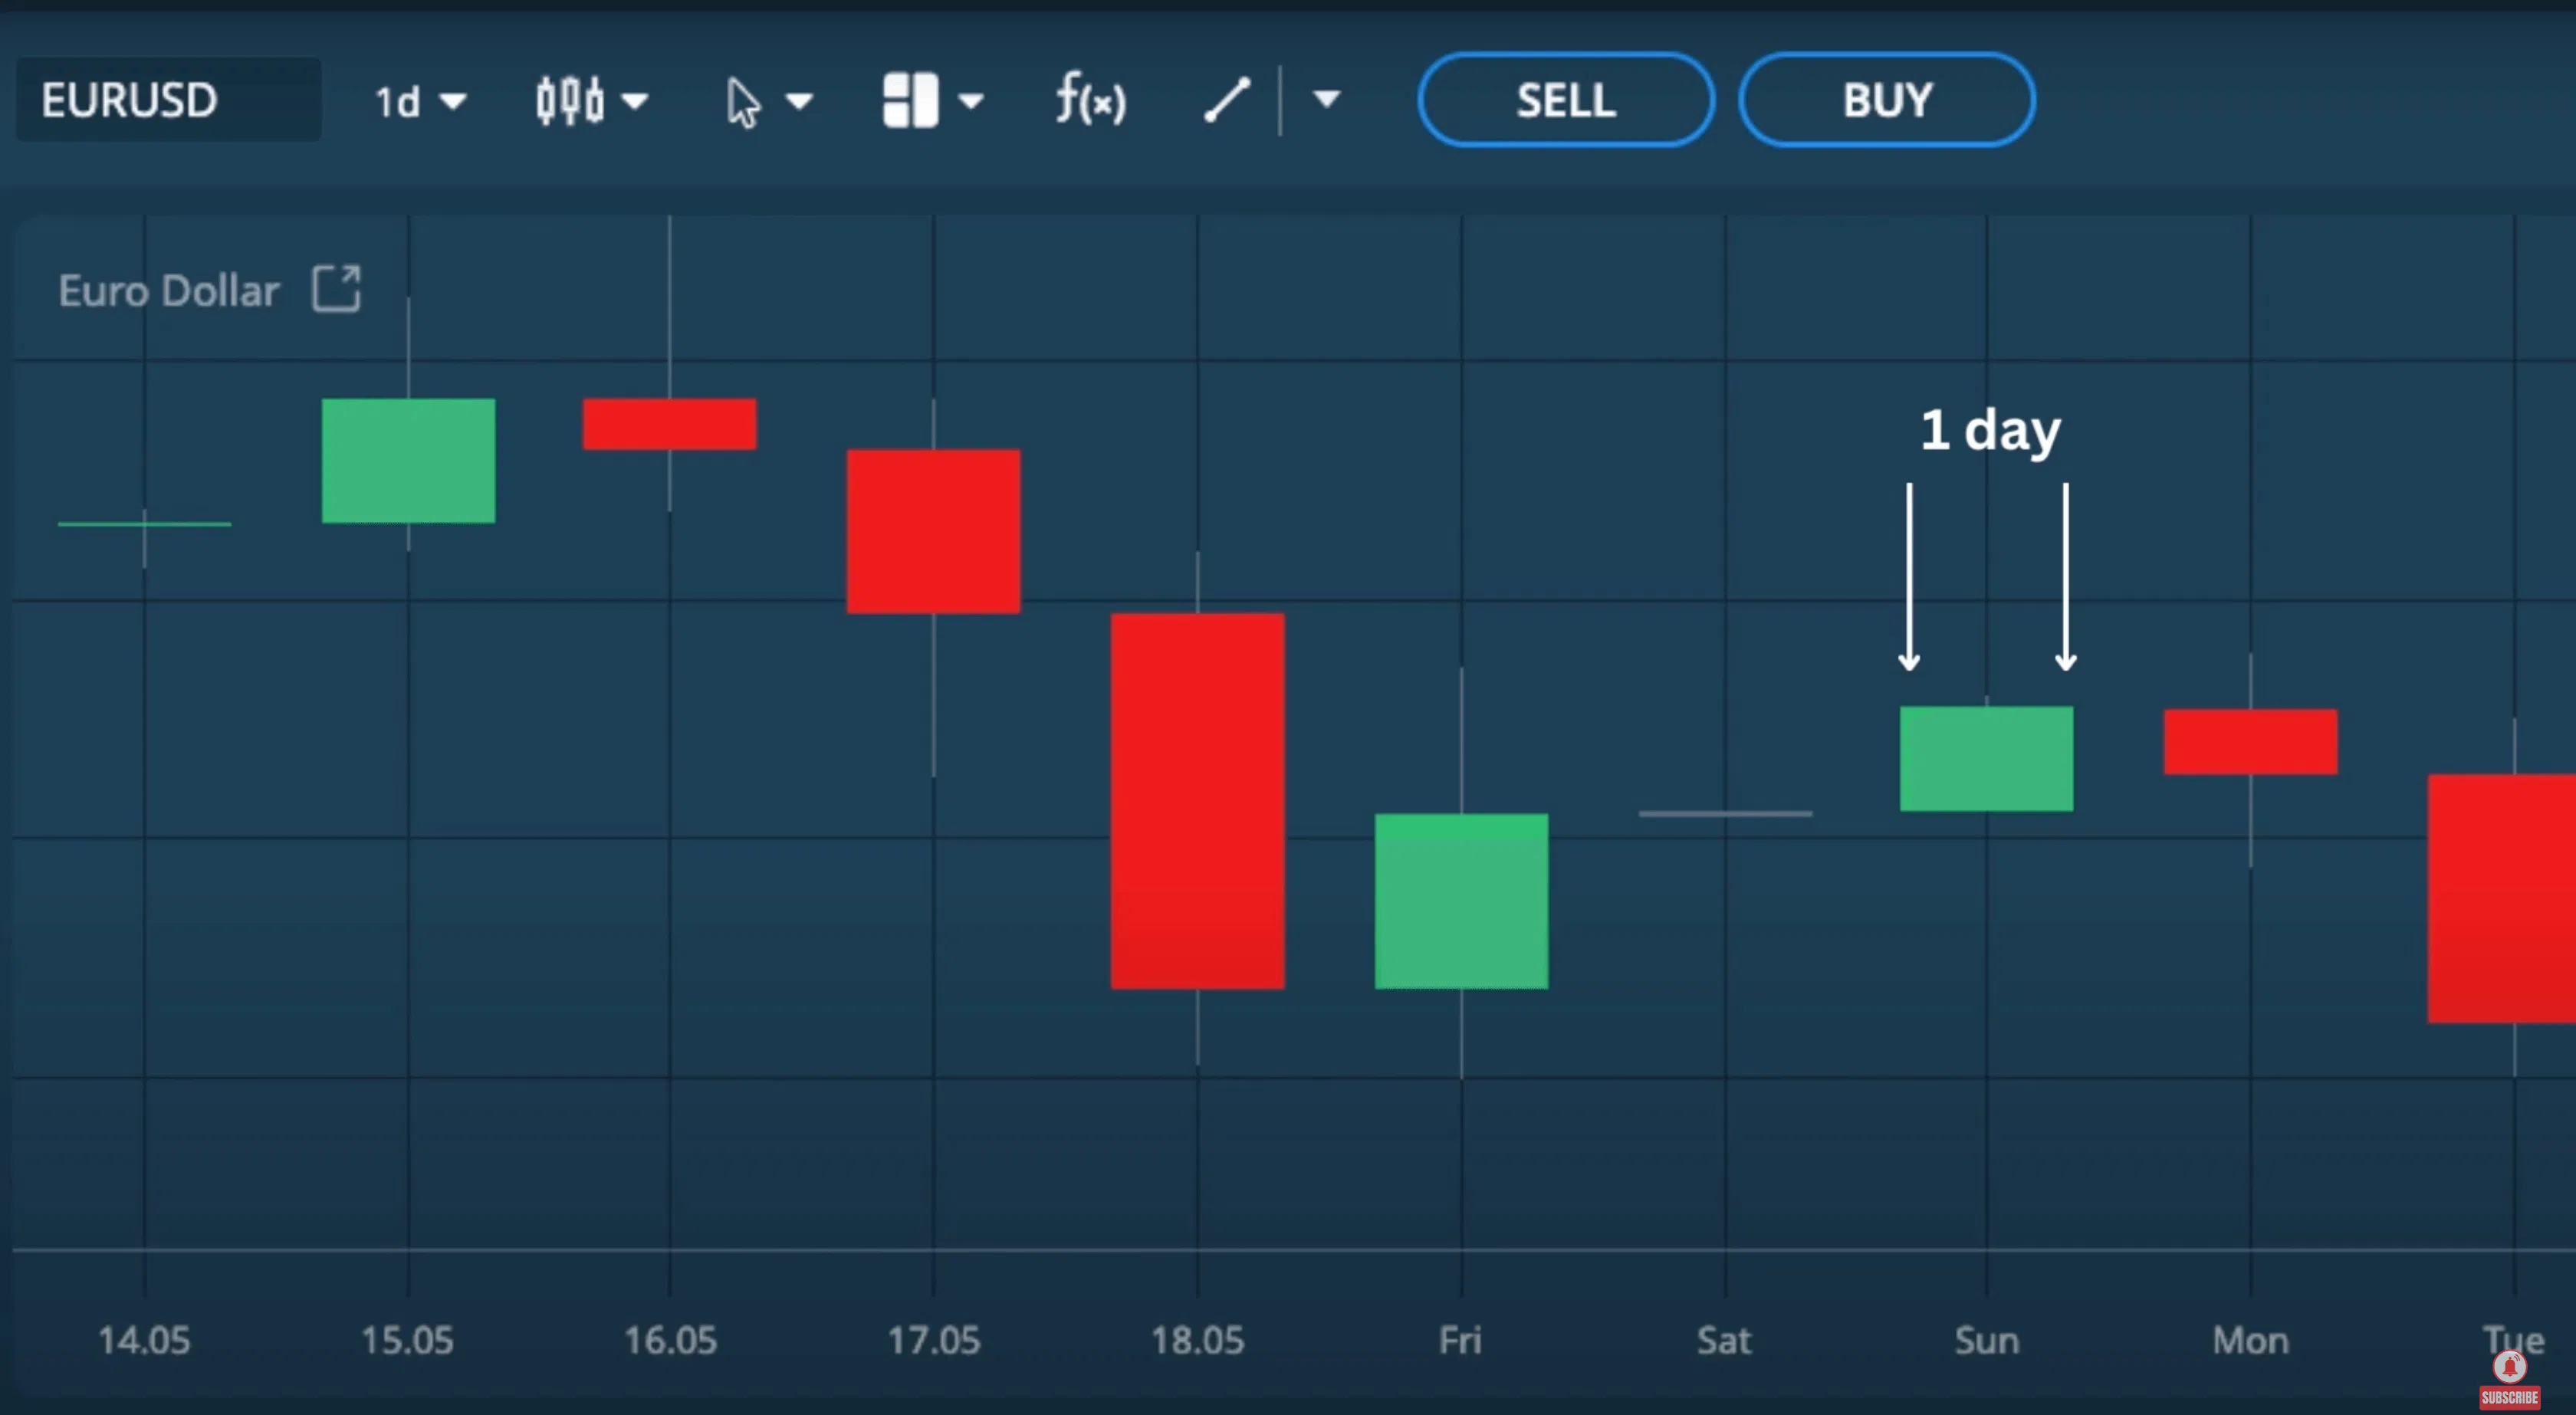
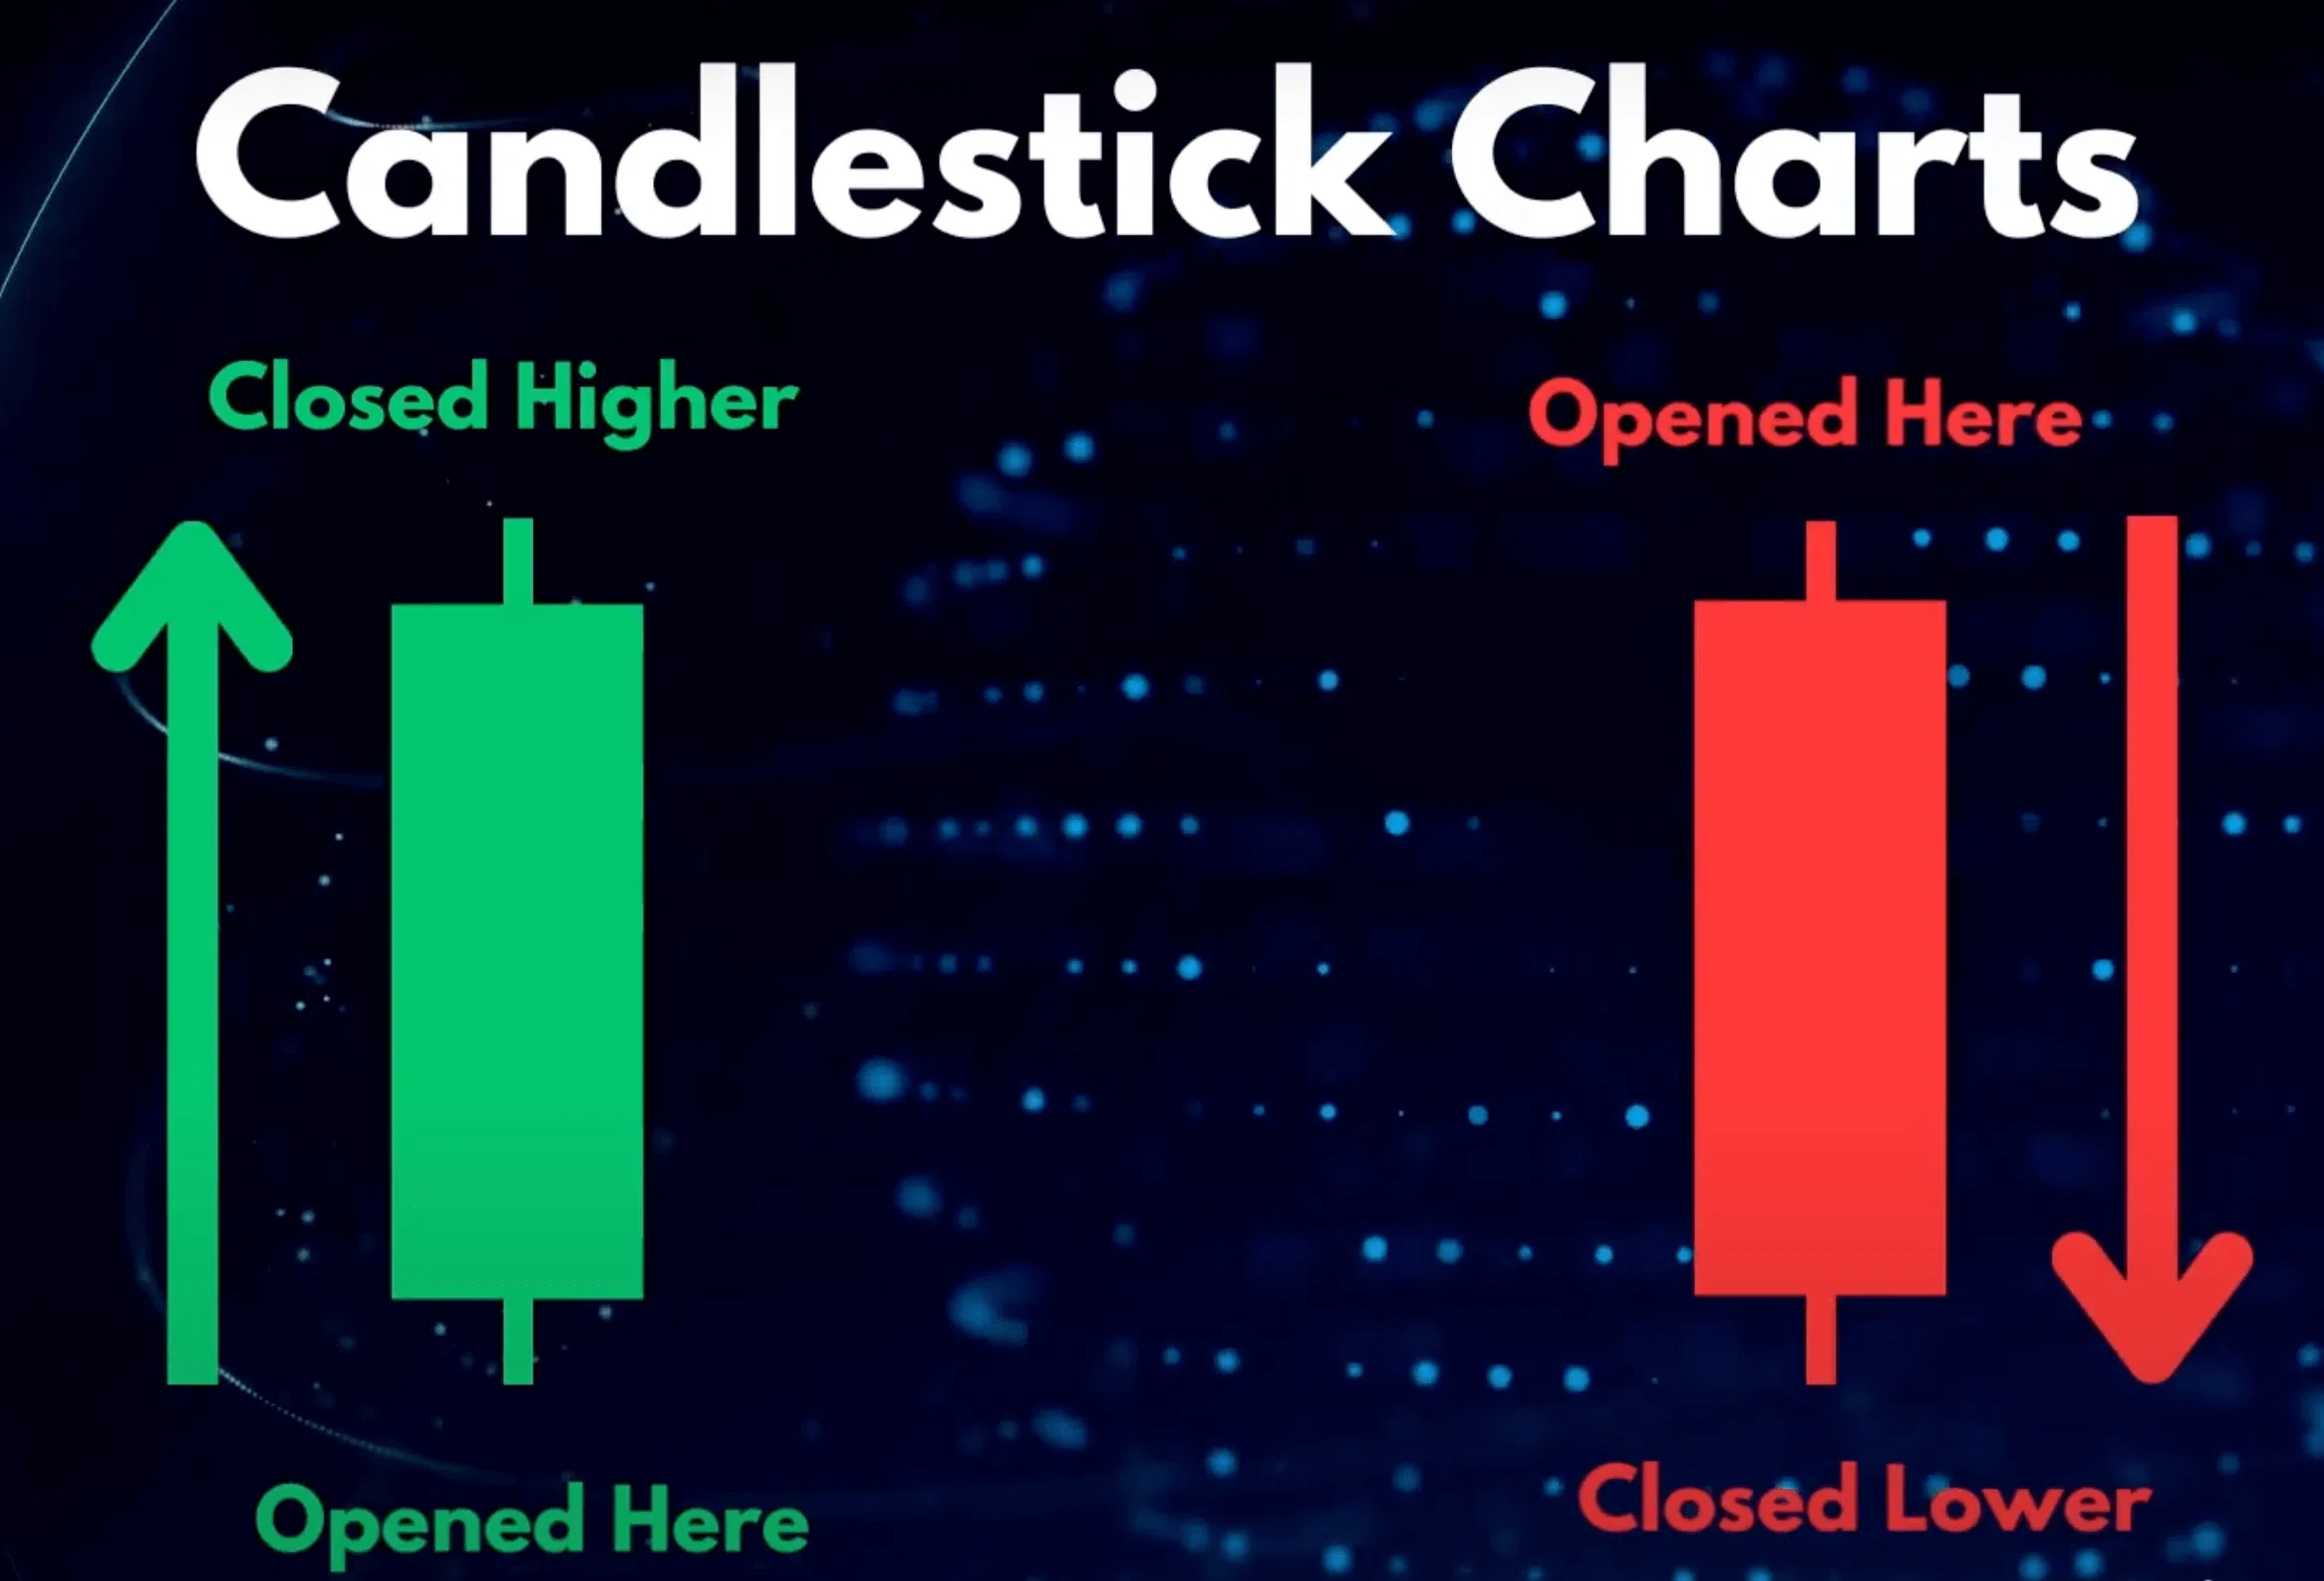
Color Coding and Market Direction
The color tells us the price direction for a given period. The most common color coding is green bodies for higher closes and red for lower ones. In this example, we’ll continue to use green for higher closes and red for lower ones.
Analyzing Candlestick Body and Wick
What is the relationship between the body and the wick? The length of the body and the wicks, in absolute terms and relative to each other, can tell us a great deal about market sentiment over the duration of any given candle on a candlestick chart.
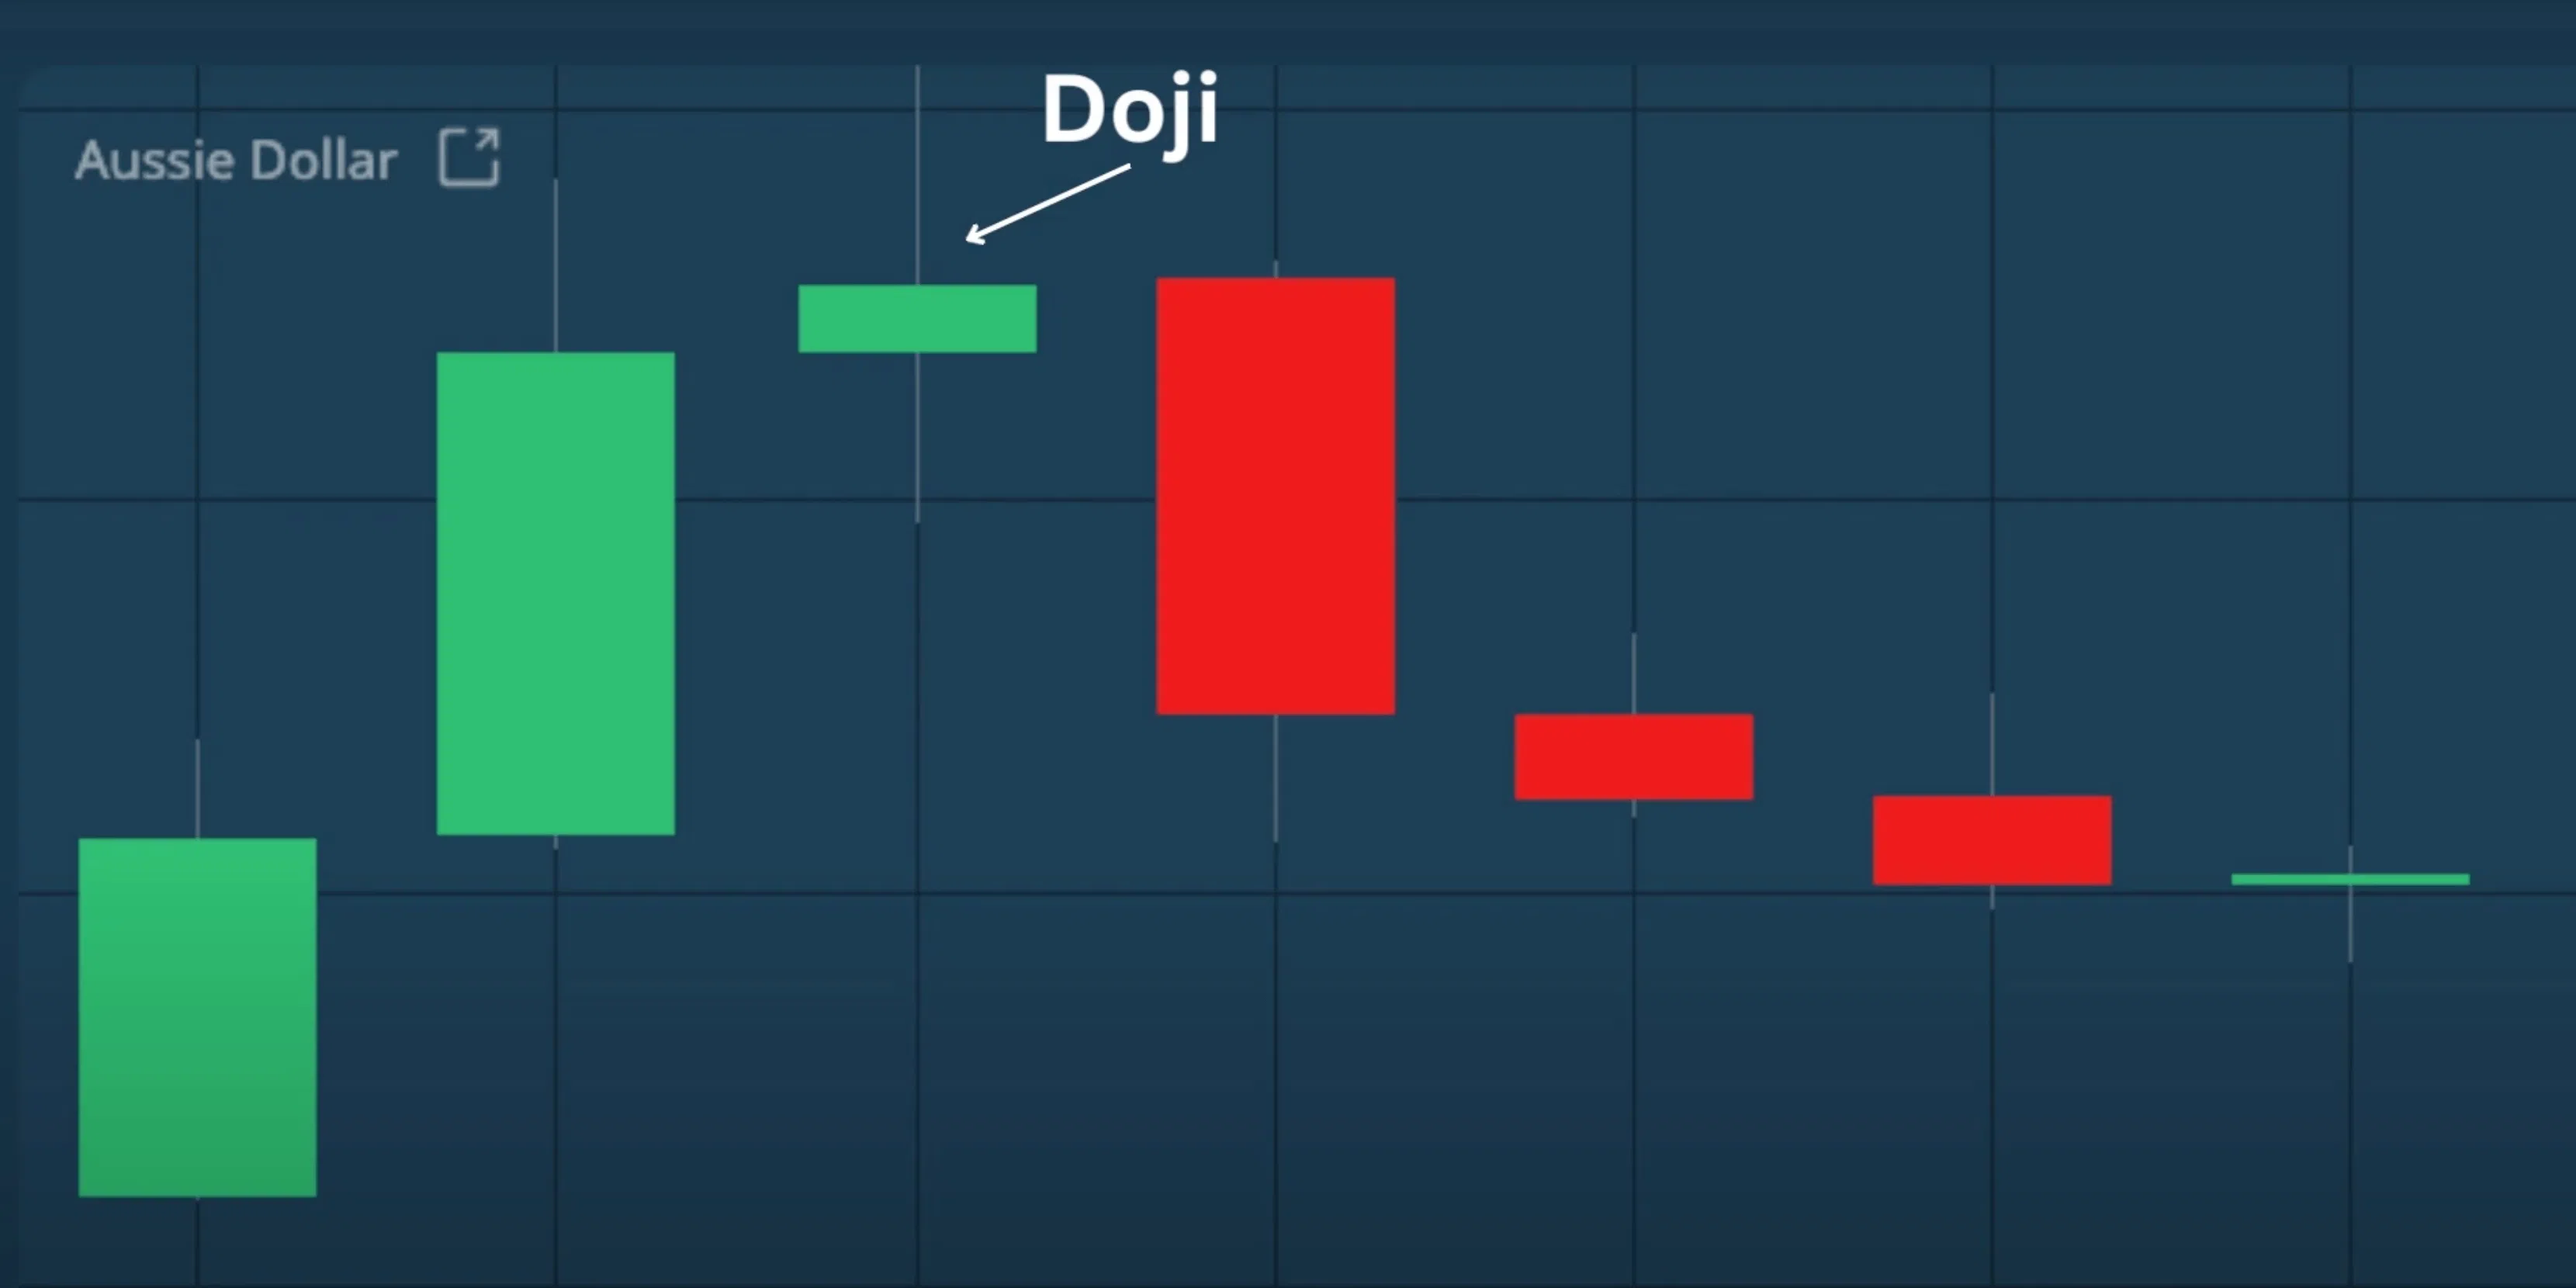
The Significance of Doji Candles
For example, let’s take a doji candle. As you can see, the doji has a very small candle body, meaning that the opening and closing prices are almost the same. This indicates indecision about the price. The longer the wicks are relative to the body, the greater the indecision, and the greater the back-and-forth struggle between buyers and sellers.
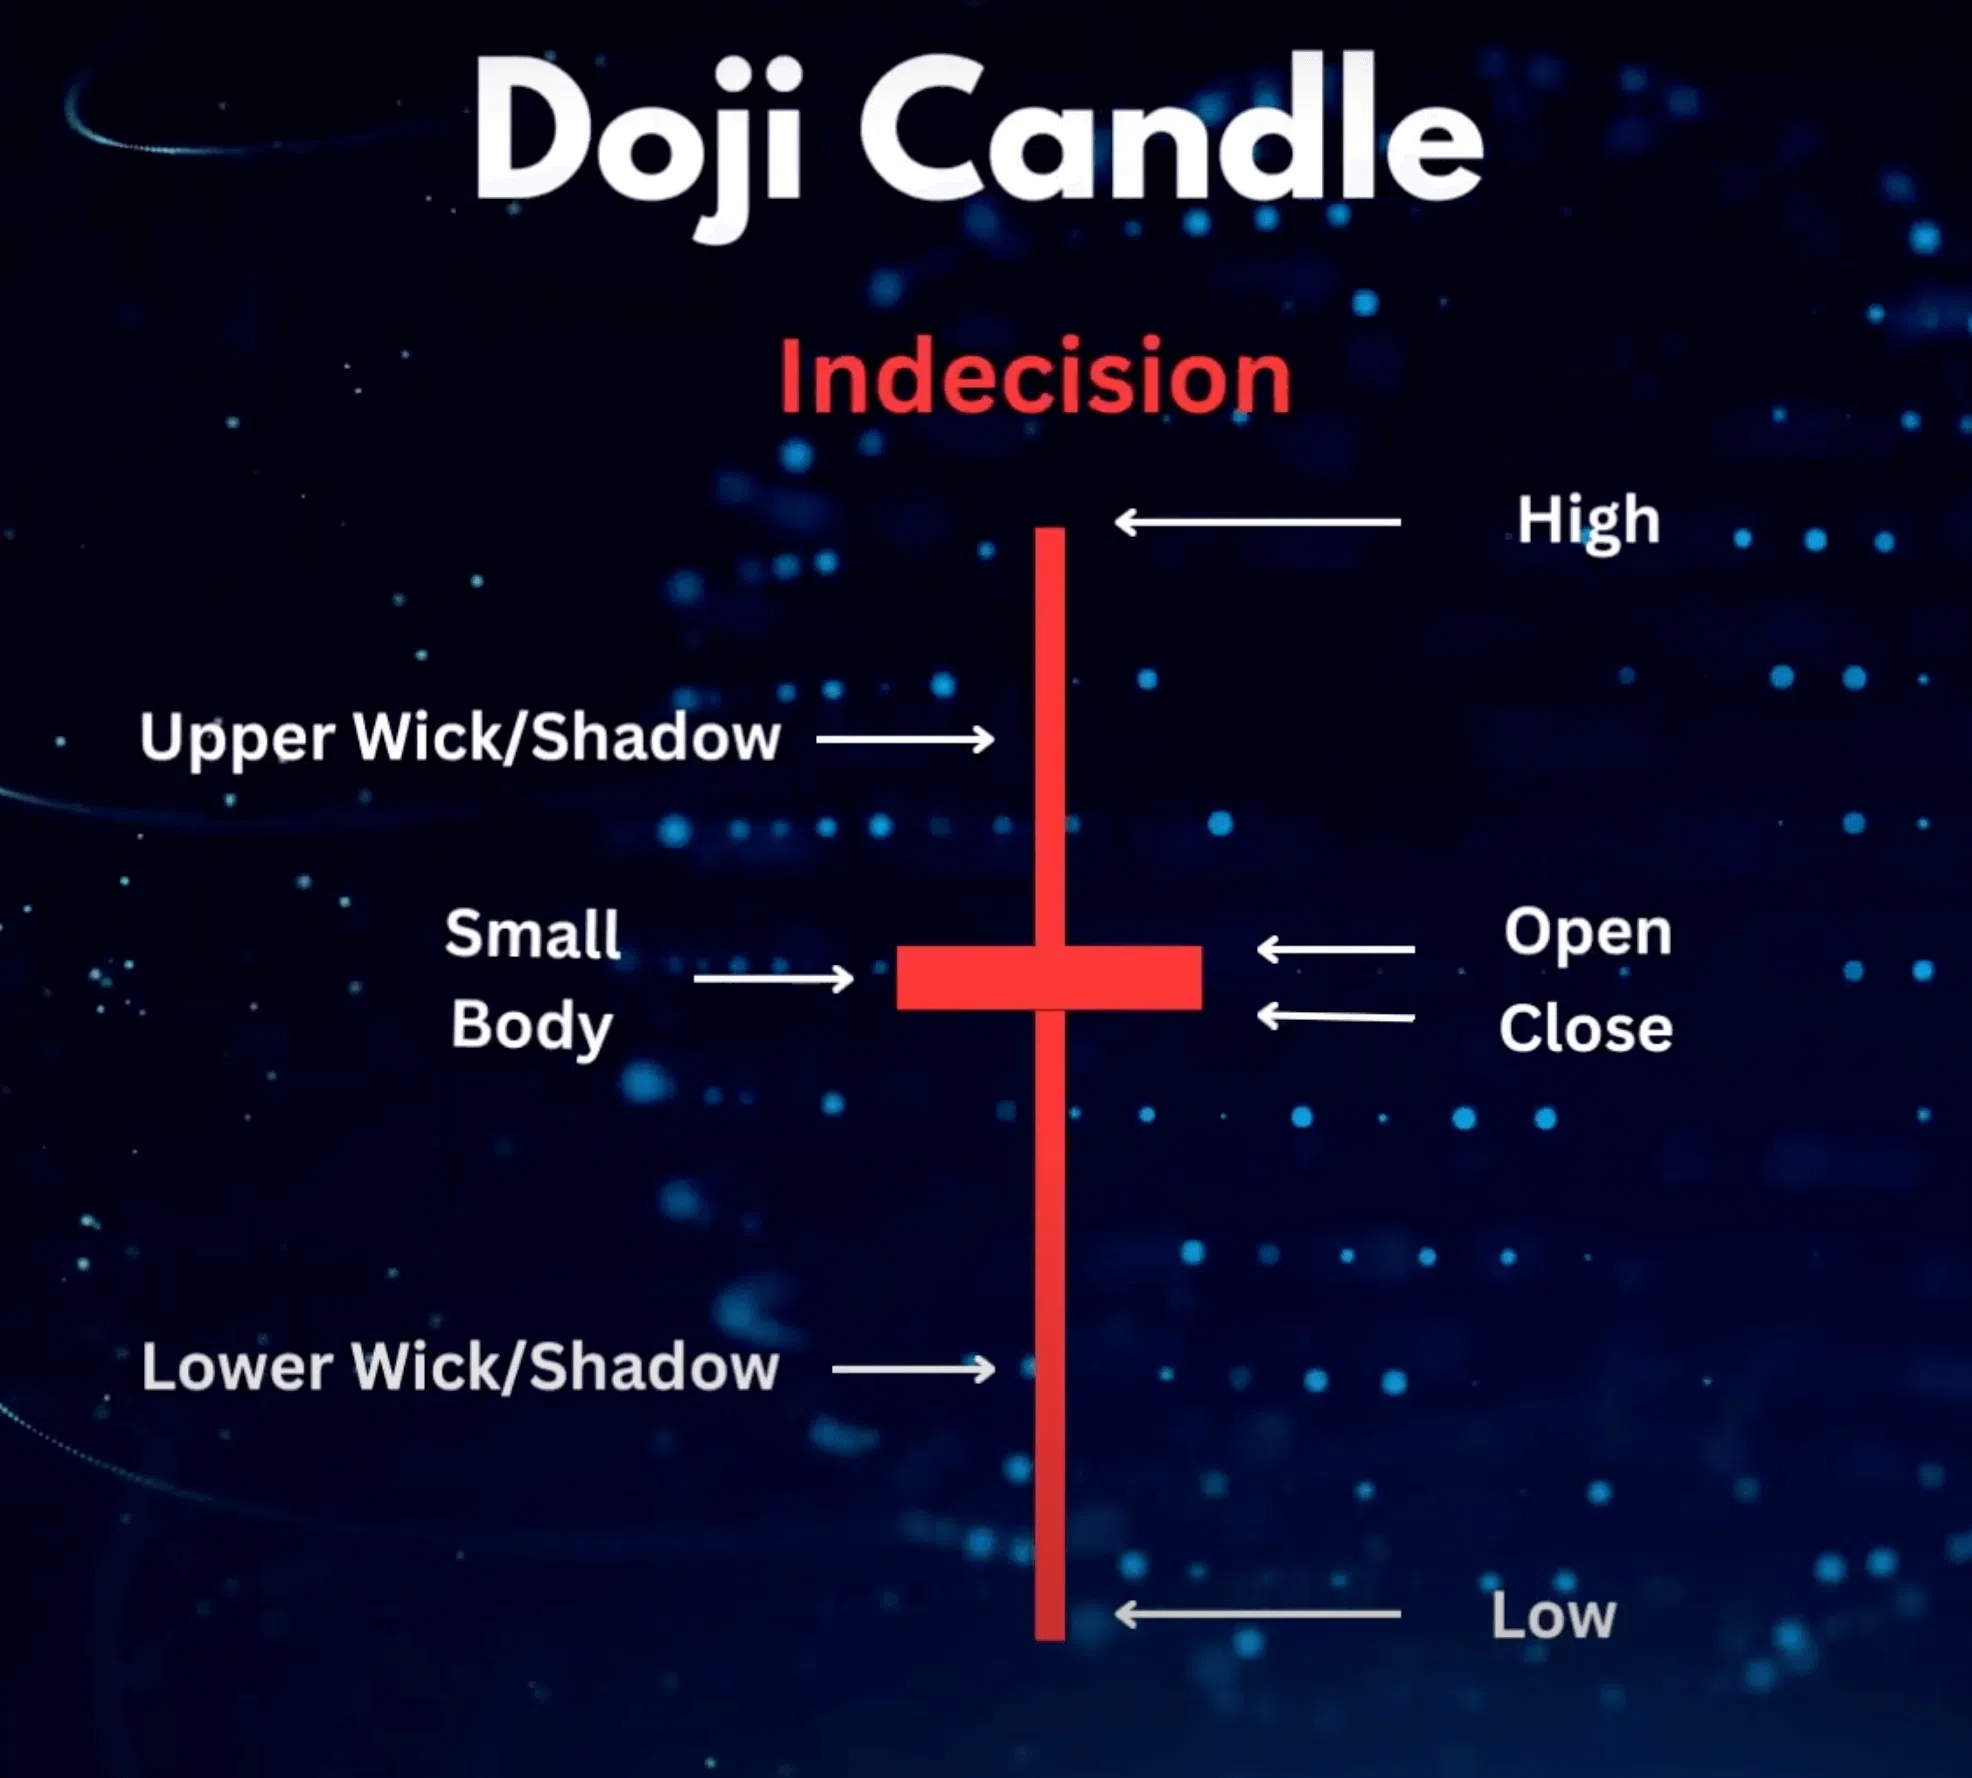
Market Indecision and Doji Candles
The market simply couldn’t make up its mind about the direction of the price. The market bounced around, and so the closing and opening prices were quite similar. When a doji occurs at the top of a strong move of, say, 5 to 10 green candles, this could signal a change in direction of the trend.
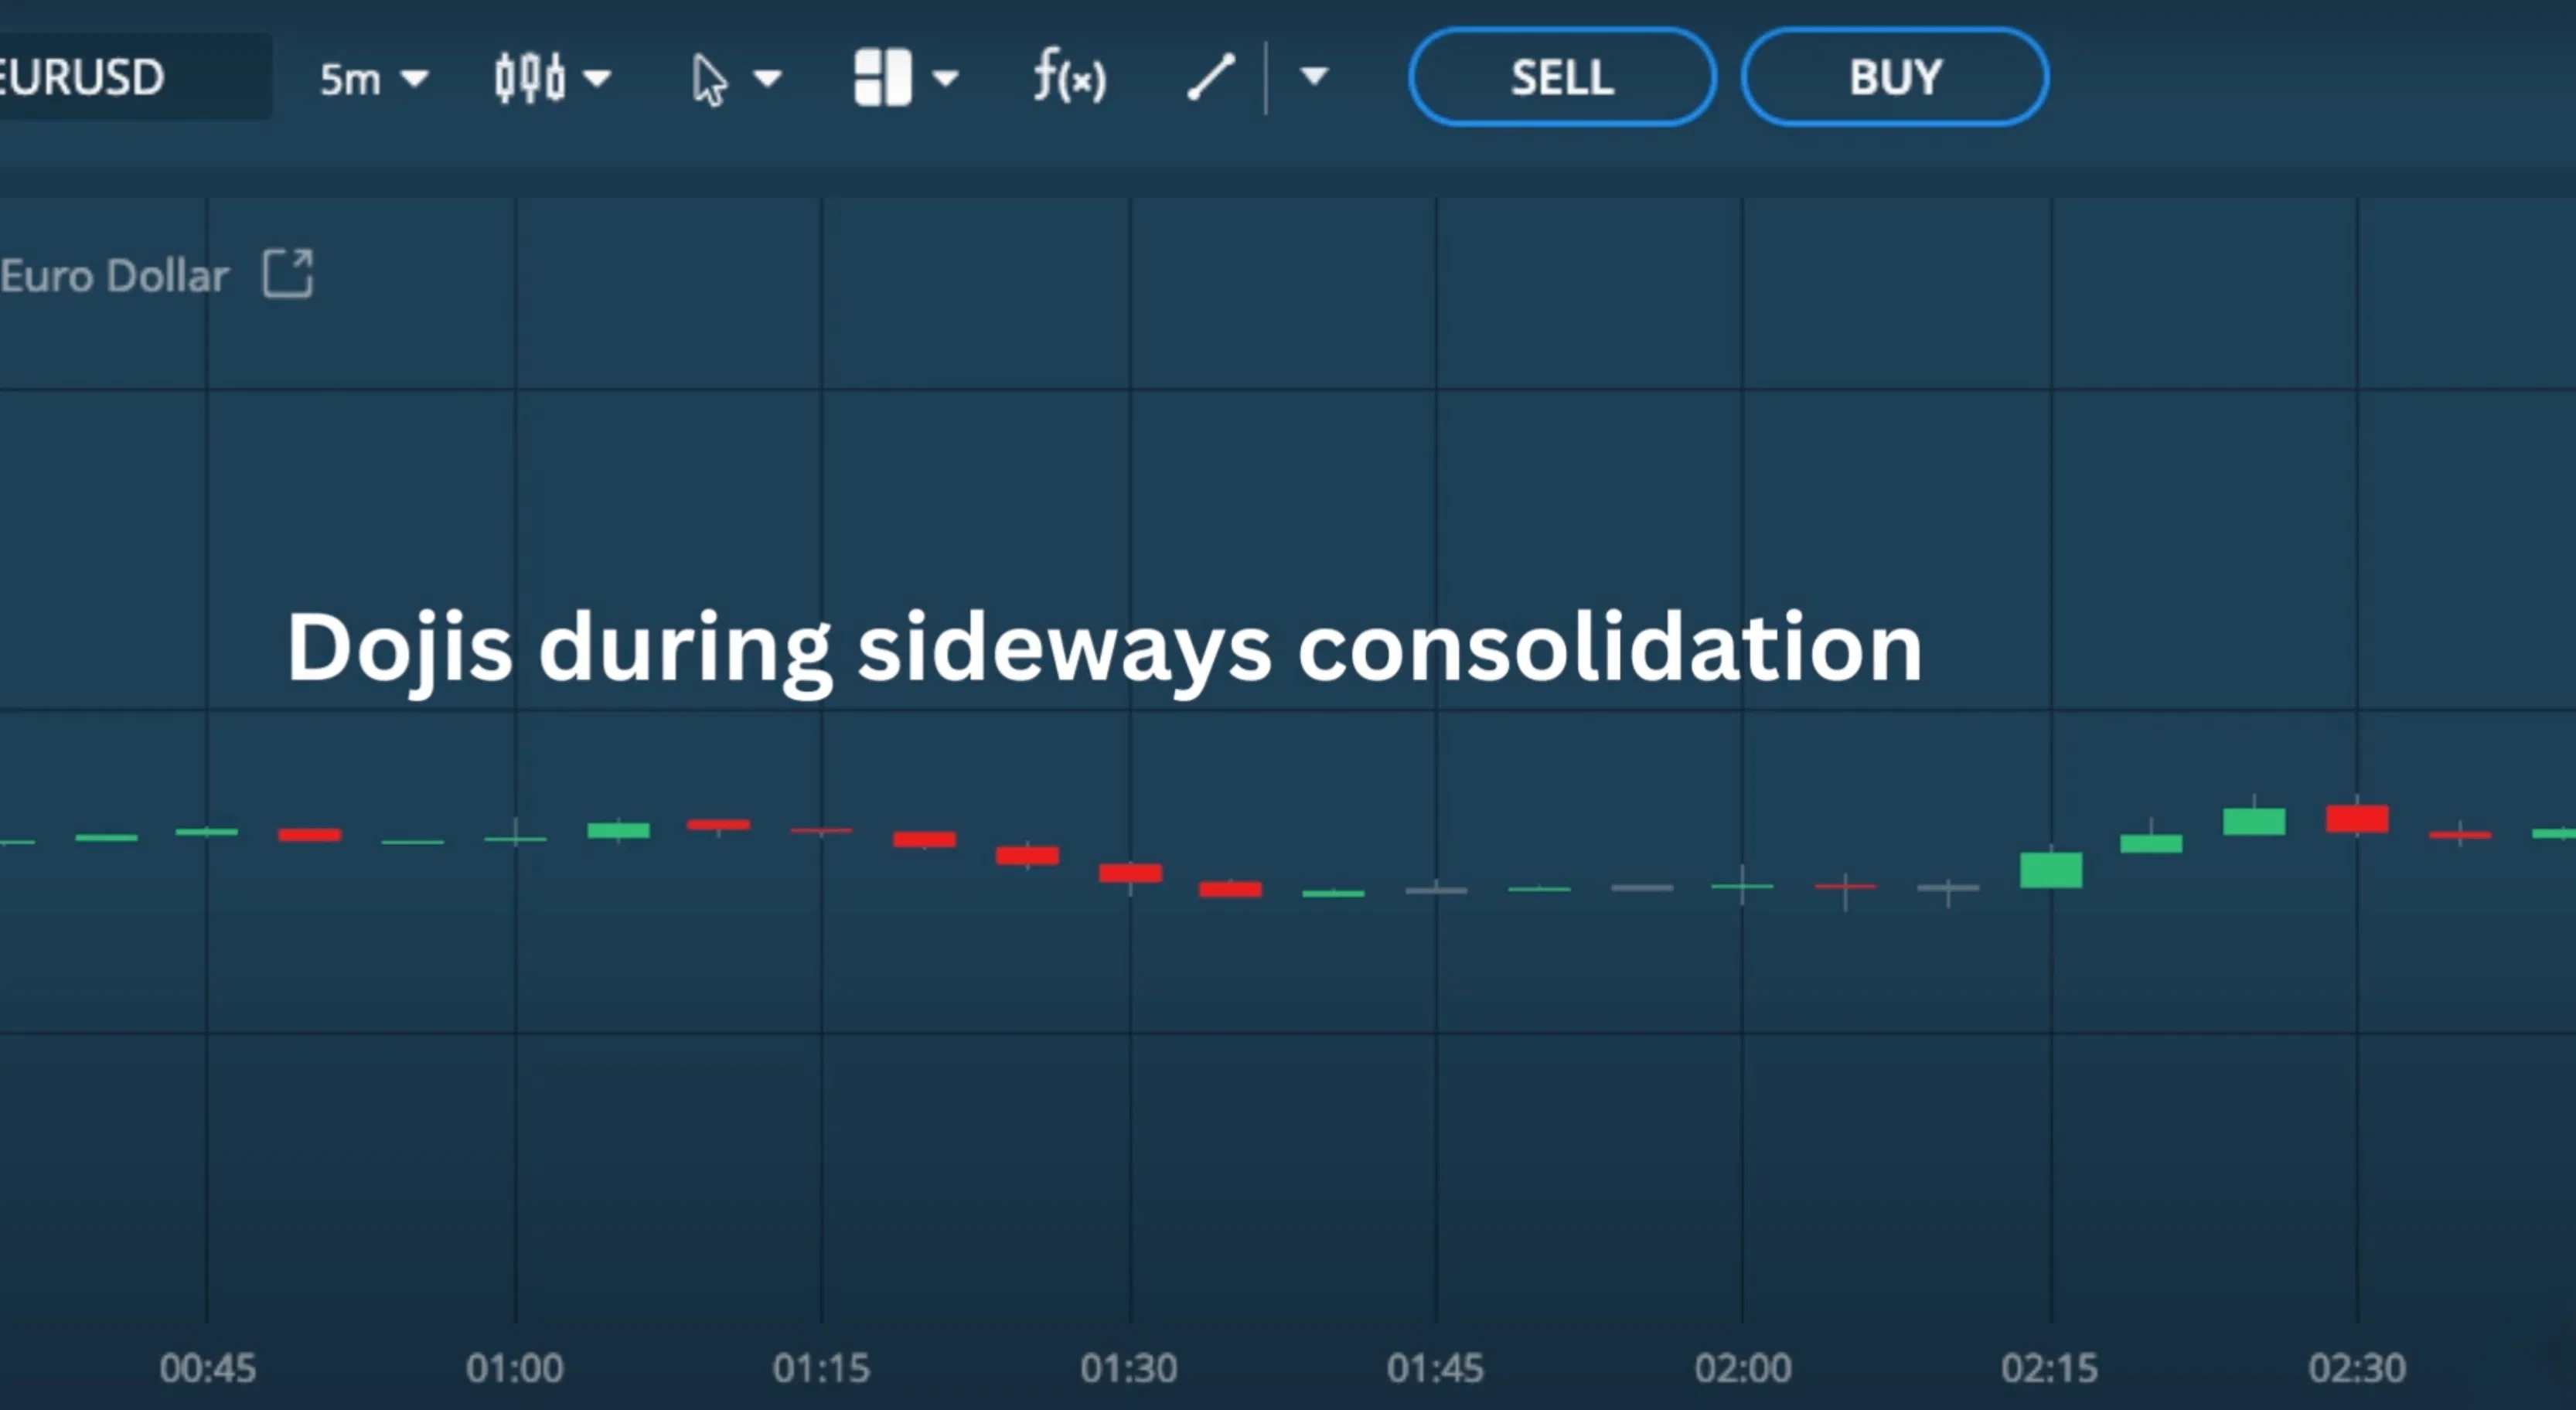
Dojis that occur during a period of sideways consolidation, however, are less significant because sideways price action really reflects indecision.
Understanding Long Body Candles
Another candlestick shape that is important to understand are long body candles. A long body candle is one which opens and surges up or down without ever-changing direction.
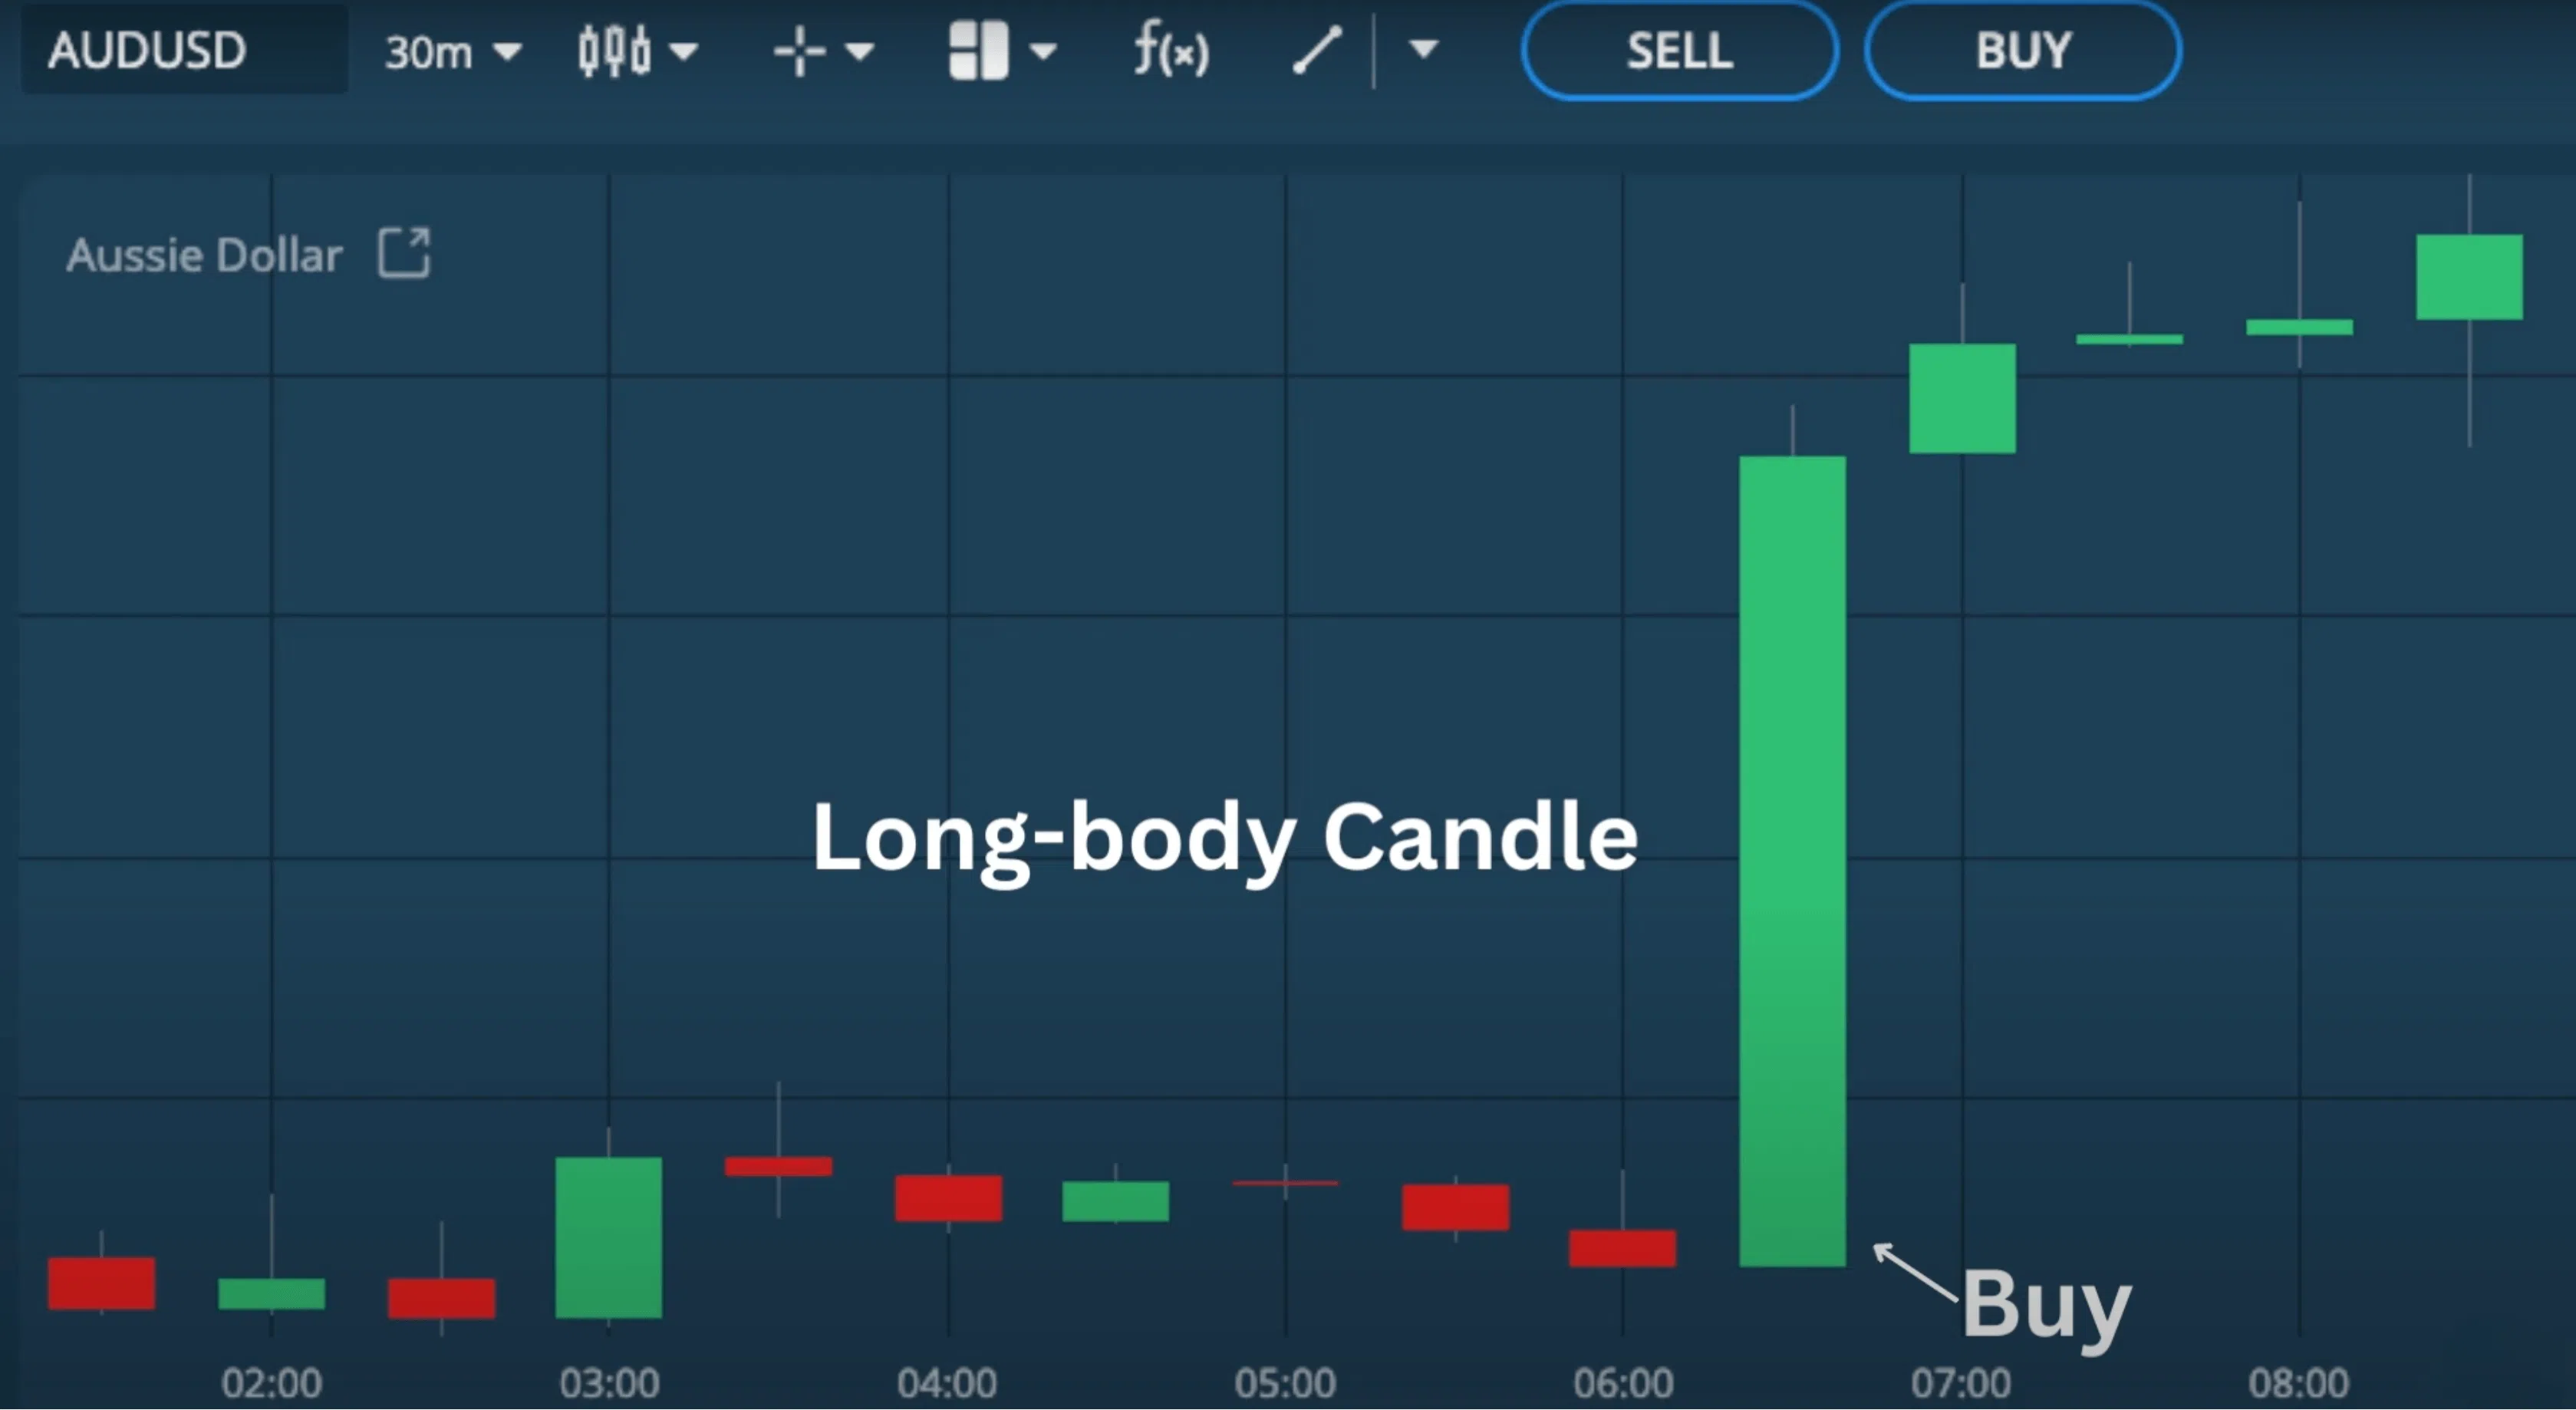
Candlestick Analysis as a Trading Tool
As traders, it is ideal to have an open position in the right direction, of course, at the start of these candles, but we seldom want open positions once these candles have been formed. Overall, candlestick products analysis can be a very powerful tool if used correctly.
Further Learning and Contact Information
We’ll also take a deeper dive into various candlestick shapes and what trading signals they provide in another page. If you have any trading-related questions, please send them to [email protected].
Share your knowledge


Stay updated
This form has double opt in enabled. You will need to confirm your email address before being added to the list.