
-
Best Forex Brokers
Our top-rated Forex brokers
-
Brokers for Beginners
Start trading here
-
Demo Accounts
Learn to trade with no risk
-
Lowest Spread Brokers
Raw spreads & low commissions
-
ECN Brokers
Trade with Direct Market Access
-
Islamic Account Brokers
Best accounts for Muslim traders
-
Market Maker Brokers
Fixed spreads & instant execution
-
All Trading Platforms
Find a platform that works for you
-
MetaTrader4 Brokers
The top MT4 brokers in the UK
-
MetaTrader5 Brokers
Best MT5 Brokers in the UK
-
TradingView Brokers
Best TradingView Brokers
-
cTrader Brokers
The top cTrader brokers in the UK
-
Copy Trading Brokers
Copy professional traders
-
Spread Betting Platforms
Tax-free trading
-
Forex Trading Apps
Trade on the go from your phone
-
Forex Brokers in UK
Trading from UK? Discover our top-rated brokers here!
-
Forex Brokers in USA
Trading from USA? Discover our top-rated brokers here!
-
Forex Brokers in Canada
Trading from Canada? Discover our top-rated brokers here!
-
Forex Brokers in Dubai
Trading from Dubai? Discover our top-rated brokers here!


Last Updated On January 11, 2024

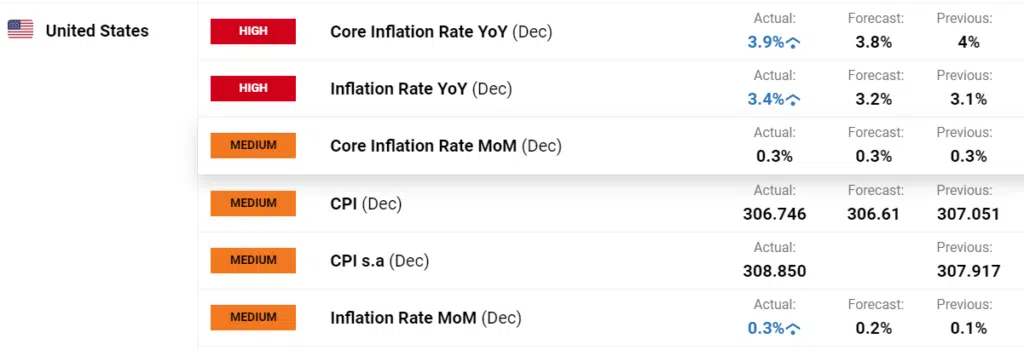
Yearly and monthly inflation figures released today showed that, while inflation is still falling in the US, it is falling slower than expected.
A slowdown in inflation reduction was expected, so the numbers weren’t a major shock – but the immediate market reaction was. The USD, as represented by the DXY index, soared following the news and the EUR/USD dropped to 1.09310.
Currency markets soon recovered however as the news was digested.
While core inflation still fell to 3.9% from December’s reading of 4%, it missed market expectations of a fall to 3.8%. Headline inflation, which includes volatile food and energy prices, rose to 3.4% – also missing market expectations of a slight rise to 3.2%.
More importantly, monthly core inflation stayed stable – exactly as markets had predicted.
The Federal Reserve has made it clear in recent weeks that it is willing to keep interest rates high for an extended period. The important takeaway from today’s data is that this view would have been partially confirmed, at least for the time being.
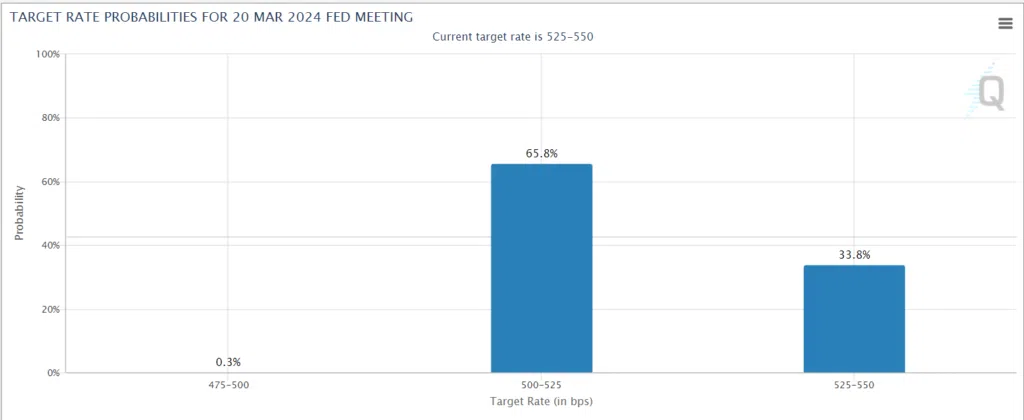
Markets are still expecting/hoping for a cut in interest rates in March, though with the CBE Fedwatch tool showing a 65% probability this is still very uncertain. Especially, with two more CPI reports, two Nonfarm Payrolls releases and another rate decision in January to come before the March decision.
With only minor differences between the actual CPI figures and expectations, we can expect currency markets to continue in the current vein, i.e. broadly sideways, until at least the next FOMC meeting at the end of January.
Technical Analysis EUR/USD
Having experienced a bearish correction from the end of December 2023 until early January, the EUR/USD respected the support level of 1.08750 created by the up-channel (green – from September 2023). Since then, it has been stuck in a range between the 1.0915 support and 1.0990 resistance. Before the PPI data was released, the pair traded at a new weekly high of 1.0990 today but dropped swiftly to the 1.0931 level off the back of higher-than-expected figures. Within an hour the pair had recovered to levels seen the previous day.
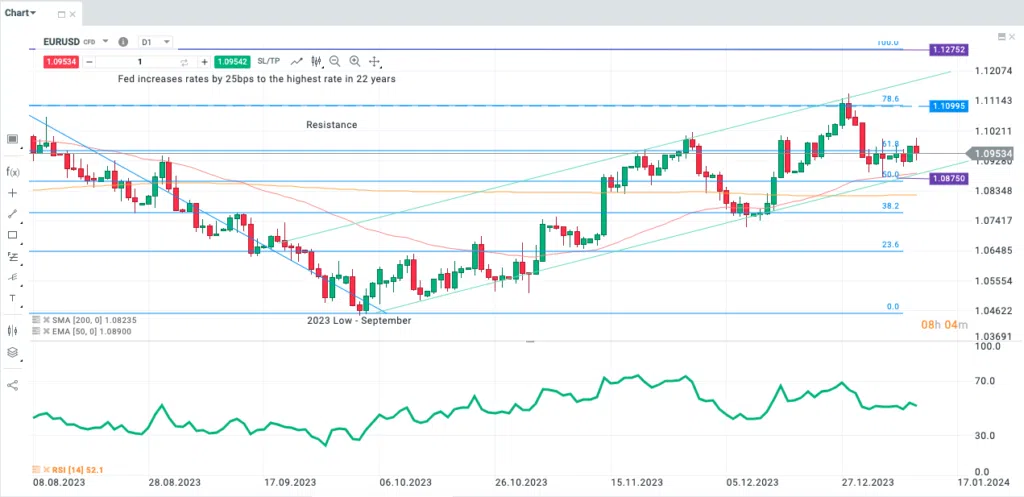
EUR/USD Daily Chart by XTB, prepared by Alison Heyerdahl
Still trading around the 61.8% Fibonacci level (of the July – September 2023 downtrend), and with the long wicks on either side of today’s candle, it seems like there is still a lot of indecision in the market.
Any strong bullish closes above the 1.100 psychological handle will shift the focus to 1.1075/1.1095, followed by 1.1140. A break to the downside is likely to trigger a selloff into the 1.07 handle.
Share your knowledge


Stay updated
This form has double opt in enabled. You will need to confirm your email address before being added to the list.