
-
Best Forex Brokers
Our top-rated Forex brokers
-
Brokers for Beginners
Start trading here
-
Demo Accounts
Learn to trade with no risk
-
Lowest Spread Brokers
Raw spreads & low commissions
-
ECN Brokers
Trade with Direct Market Access
-
Islamic Account Brokers
Best accounts for Muslim traders
-
Market Maker Brokers
Fixed spreads & instant execution
-
All Trading Platforms
Find a platform that works for you
-
MetaTrader4 Brokers
The top MT4 brokers in the UK
-
MetaTrader5 Brokers
Best MT5 Brokers in the UK
-
TradingView Brokers
Best TradingView Brokers
-
cTrader Brokers
The top cTrader brokers in the UK
-
Copy Trading Brokers
Copy professional traders
-
Spread Betting Platforms
Tax-free trading
-
Forex Trading Apps
Trade on the go from your phone
-
Forex Brokers in UK
Trading from UK? Discover our top-rated brokers here!
-
Forex Brokers in USA
Trading from USA? Discover our top-rated brokers here!
-
Forex Brokers in Canada
Trading from Canada? Discover our top-rated brokers here!
-
Forex Brokers in Dubai
Trading from Dubai? Discover our top-rated brokers here!


Last Updated On July 1, 2024

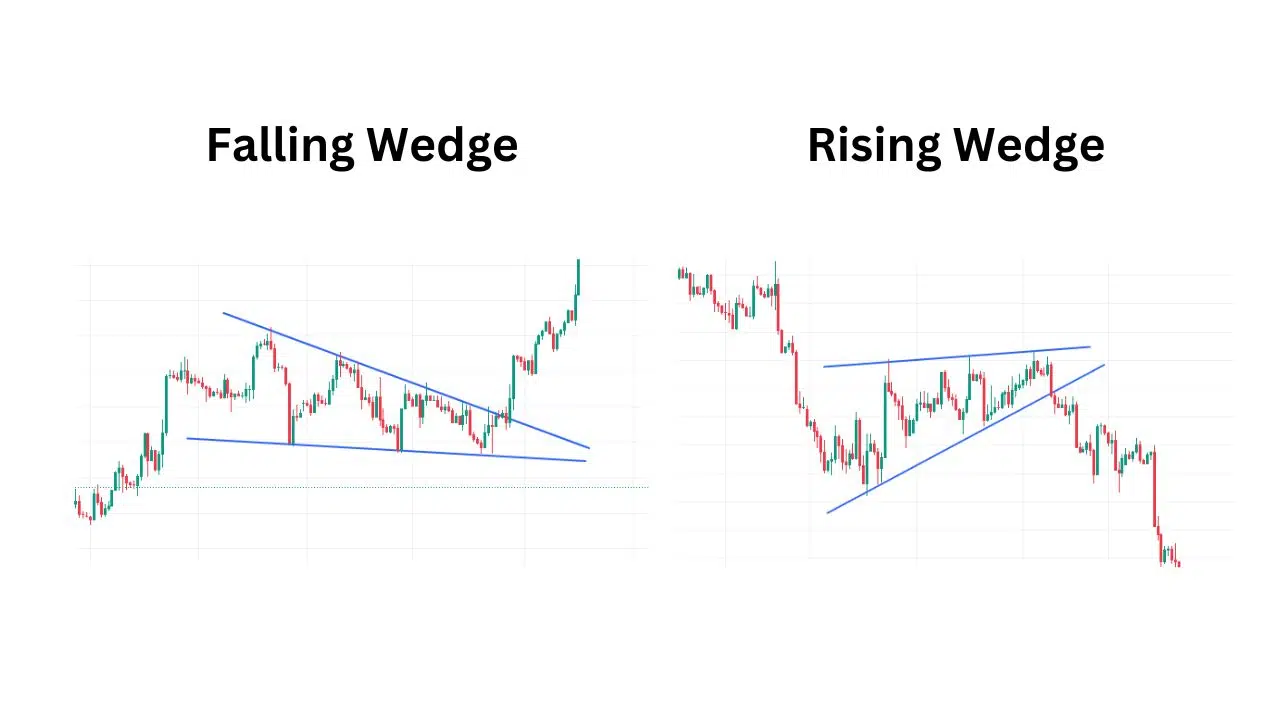
A wedge pattern is the convergence of two lines. It means that the magnitude of price movement is decreasing. They signal a pause in the current trend and that forex traders are still deciding where to take the pair next.
Transcript
Wedges are very prominent in the charts; you’ll see them often. They are characterized by the convergence of two diagonal lines and signify that the magnitude of price is decreasing. This means that market participants are deciding which way the price should go. There are two different types of wedge patterns: falling wedges and rising wedges. Both can be continuation or reversal patterns depending on where they fall on the chart.
Rising Wedges
First, let’s have a look at rising wedges. A rising wedge is formed when the price consolidates between upward-sloping support and resistance lines, where the support line’s slope is steeper than the resistance line’s. This indicates that higher lows are being formed faster than higher highs, leading to a wedge-like formation, which is where the chart pattern gets its name.
With prices consolidating, we know that a big move is coming, so we can expect a breakout to the top or the bottom. It’s important to note that if a rising wedge occurs after an uptrend, it is a bearish reversal signal. On the other hand, if the rising wedge occurs after a downtrend, it is a continuation pattern, and the price will continue to move down. Either way, it’s very important that you’re ready with your entry, depending on whether an uptrend or a downtrend preceded the wedge pattern.
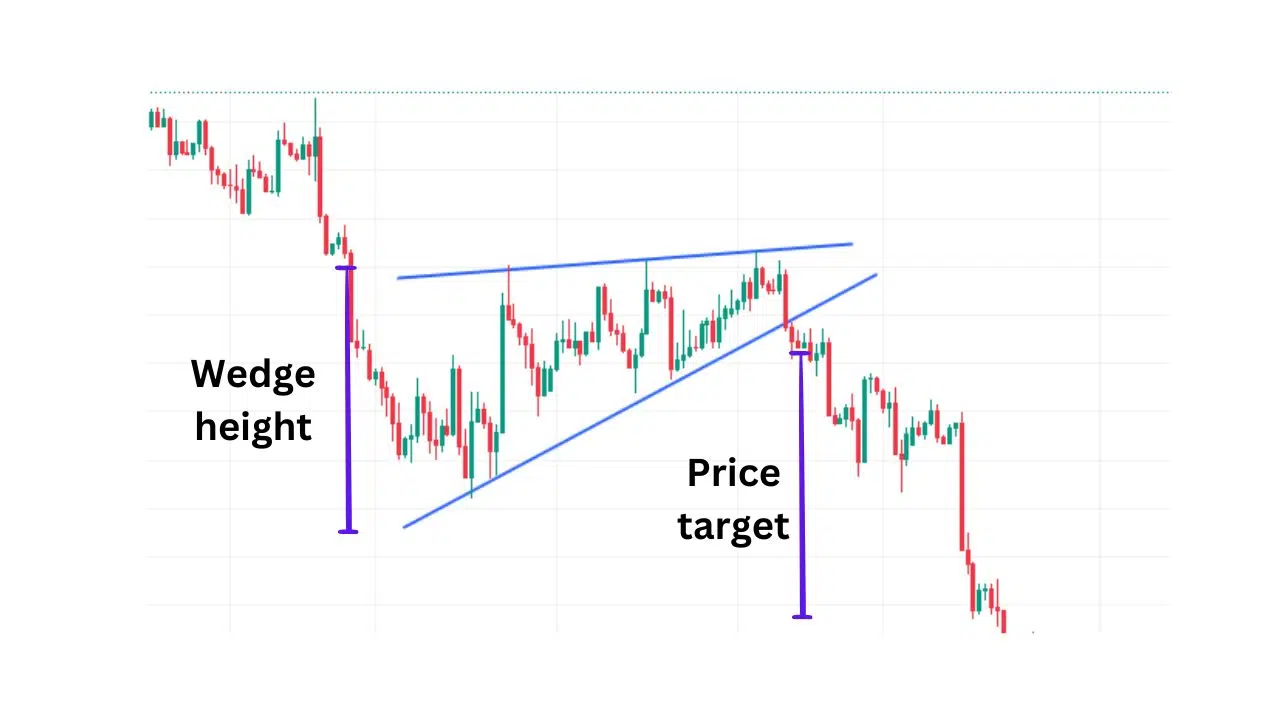
Example of a Rising Wedge After an Uptrend
In this first example, a rising wedge formed at the end of an uptrend. The price action forms new highs but at a much slower pace than when the price makes higher lows. The price then broke to the downside because the bulls simply couldn’t push the price past the resistance. They pushed the price back down, breaking the trend line and indicating a downtrend. The price movement after the breakout is approximately the same magnitude as the height of the formation.
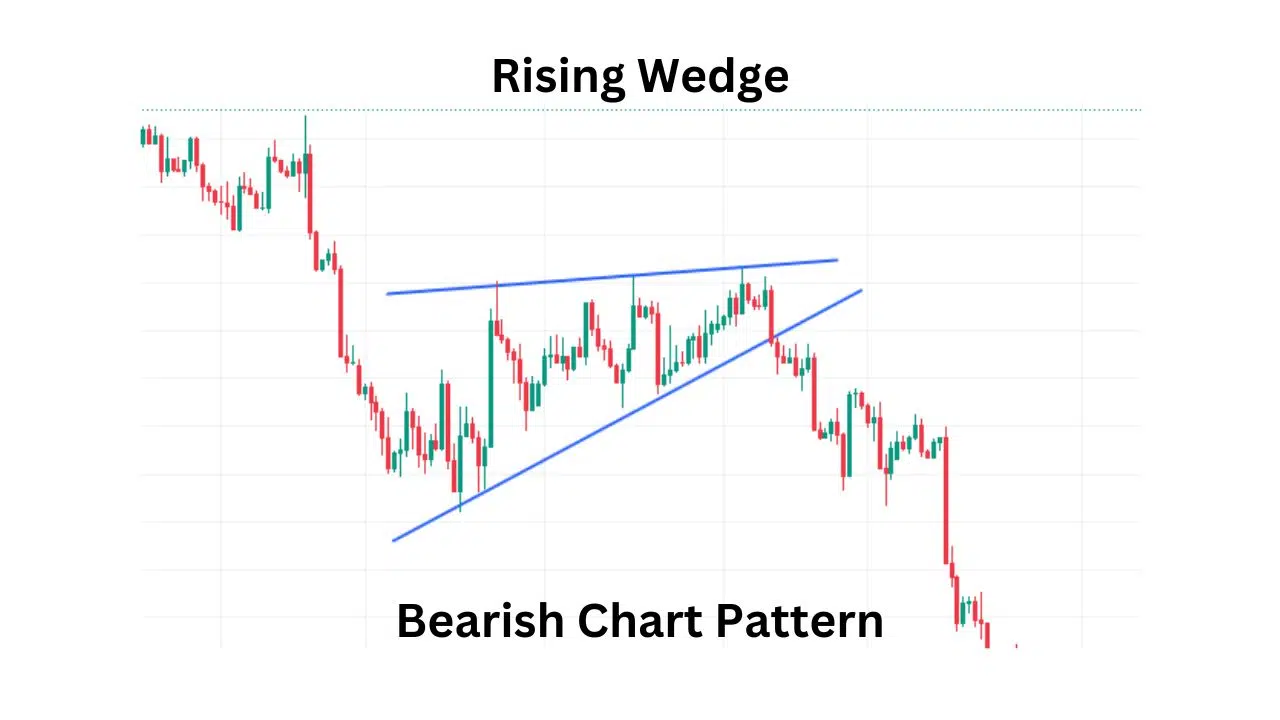
Example of a Rising Wedge After a Downtrend
Let’s take a look at another rising wedge formation, only this time it comes after a downtrend. The price came down from a downtrend before consolidating and then made higher highs and even higher lows. In this case, the price broke to the downside, and the downtrend continued, which is why it’s called a continuation signal. The price made a nice move down that’s the same height as the wedge. A rising wedge after a downtrend is a signal of continuation, but either way, a rising wedge will lead to a downtrend, making it a bearish chart pattern.
Falling Wedges
Now let’s look at the falling wedge. Like the rising wedge, a falling wedge can be a continuation or a reversal signal. As a reversal signal, it’s formed at the end of a downtrend, indicating that an uptrend may be on the cards. If it occurs at the end of an uptrend, it’s a continuation signal that the price will continue to move up. Basically, a falling wedge is a bullish chart pattern.
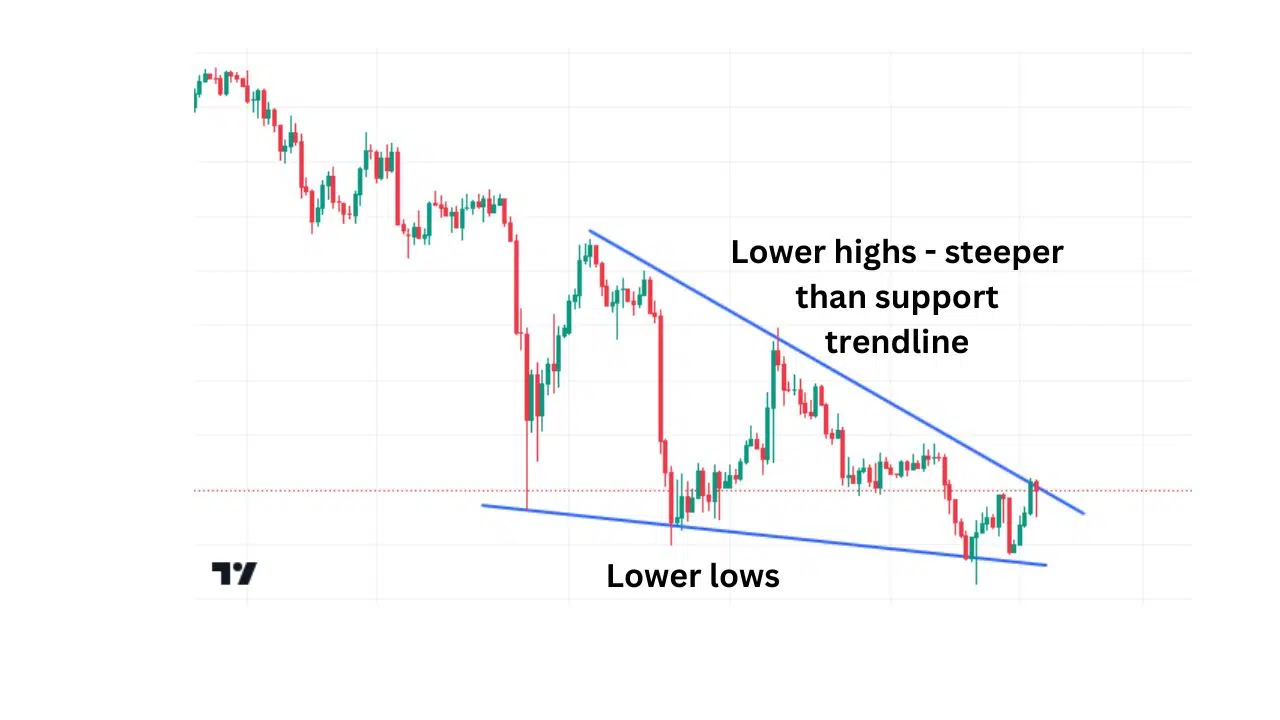
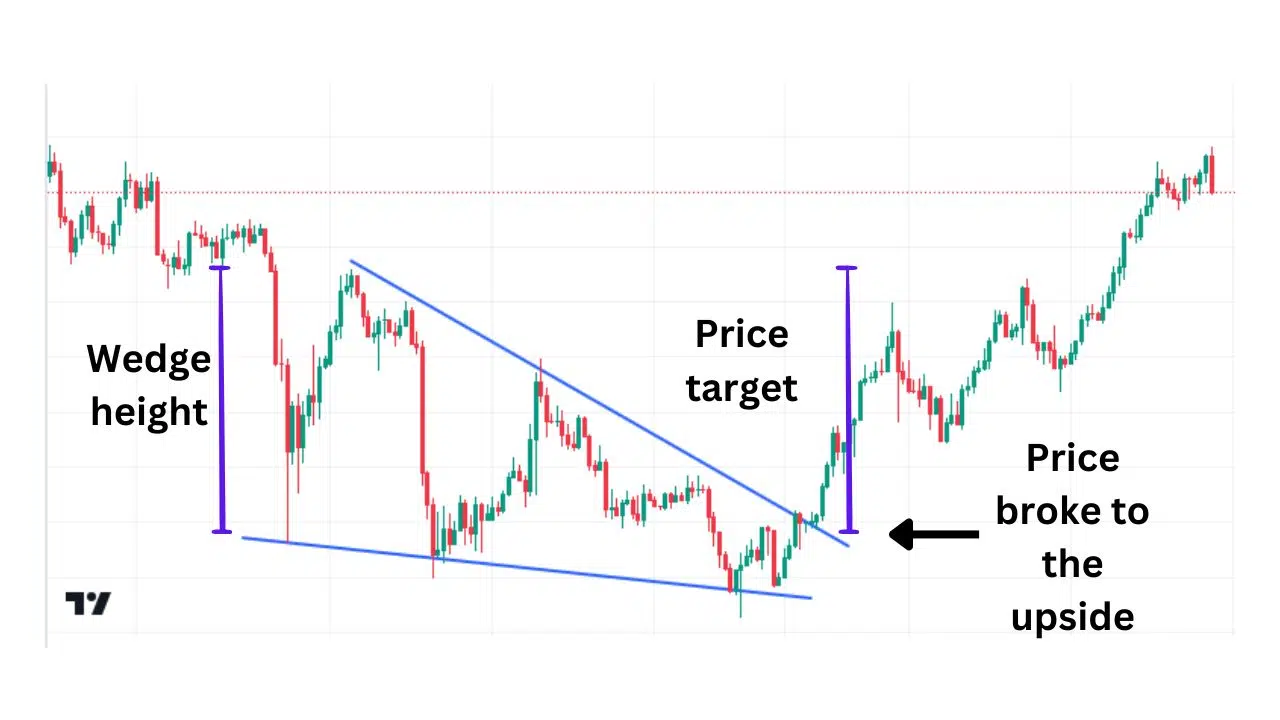
Example of a Falling Wedge After a Downtrend
In this example, after the downtrend, the price made lower highs and lower lows. Notice how the falling trend line connecting the highs is steeper than the trend line connecting the lows. Upon breaking above the top of the wedge, the pair makes a nice move upwards that’s approximately equal to the height of the formation.
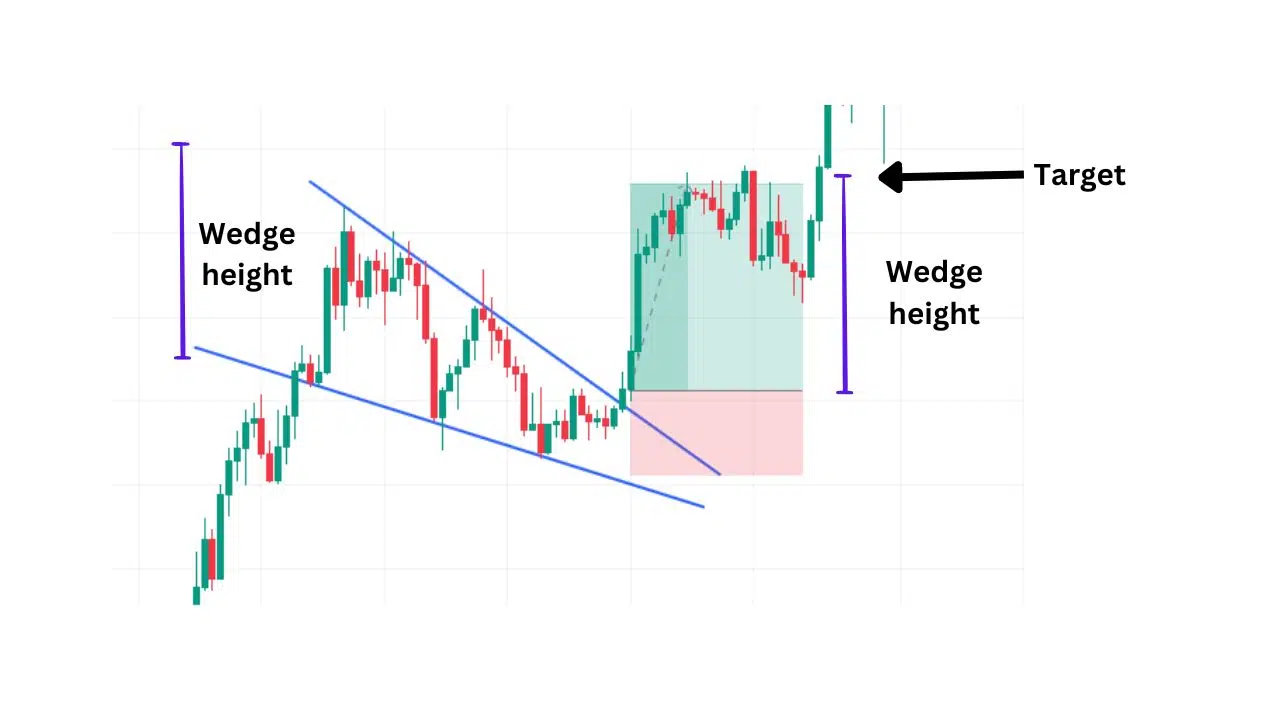
Example of a Falling Wedge During an Uptrend
Now let’s look at an example where a falling wedge is a signal of a continuation pattern. When the falling wedge forms during an uptrend, it usually signals that the trend will resume later. In this case, the price consolidated after a very strong rally, meaning that buyers paused to catch their breath during the pullback before resuming the move up. See how the price broke to the top side and then continued to climb higher. If we placed an entry order above the falling trend line connecting the pair’s highs, we would have been able to move in on the uptrend and caught some good price action. A good upside target is basically the height of the wedge.
Thank you so much for reading! If you have any questions, please don’t hesitate to contact us at arts.com or write a comment in the comment section below. And please remember to subscribe and like—it means we can continue to make more free content like this.
For more Forex trading education, check out our education hub here.
If you are looking for a well-regulated broker, check out our list here.
Share your knowledge


Stay updated
This form has double opt in enabled. You will need to confirm your email address before being added to the list.